地図データ配信について
社会正義(ジェンダー、多様性、人権など)、人口・健康(出生・死亡・人口移動・公衆衛生・医療福祉など)、環境(植生・食糧生産、災害)などのESDに関連するGISデータをアップしていきます。
当データベースの利用方法
Mandara形式のデータ(CSVおよびMDR)および、Google Earth用のKML形式のデータを公開しています。
「電子国大 オンライン配信教材利用規約」に同意した上で、ご利用ください。
・Mandara
Mandaraは、エクセル等の表計算ソフト上の地域統計データを地図化することに適したWindowsで利用できる無料のGISソフトです。
公式サイトよりダウンロードしてご利用ください。
・Google Earth
Google Earth用は、Googleが提供するWEBGISシステムです。WEB上で閲覧でききるGoogle Earth、スマートフォンやタブレット用アプリ、パソコン用アプリであるGoogle Earth Proの3つバージョンが提供されています。
Google Earth 公式サイト
世界のデータ World Map for ESD
社会正義 Social Justice
ジェンダー Gender
Mandara
-
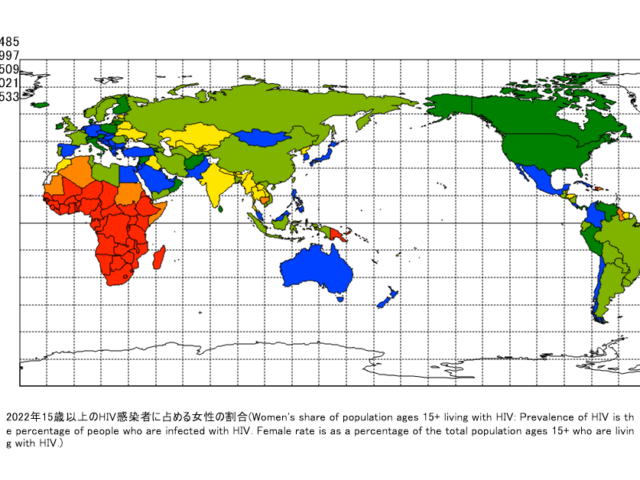
2022年15歳以上のHIV感染者に占める女性の割合
Title
Women’s share of population ages 15+ living with HIV: Prevalence of HIV is the percentage of people who are infected with HIV. Female rate is as a percentage of the total population ages 15+ who are living with HIV.
Source
DataBank Gender Statistics (https://databank.worldbank.org/). Source: UNAIDS estimates
Google Earth
-
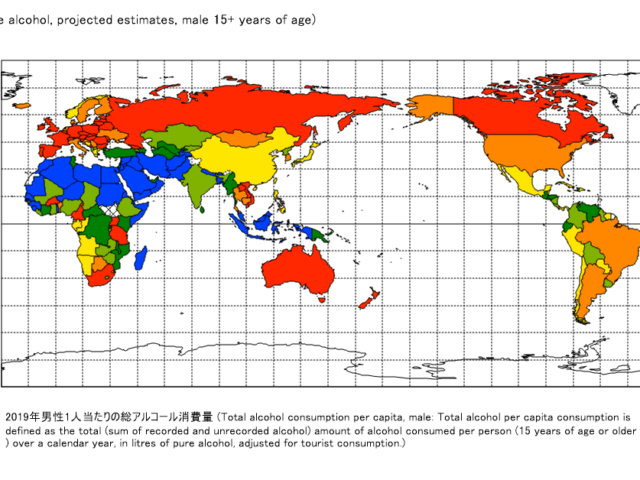
2019年男性1人当たりの総アルコール消費量
Title
Total alcohol consumption per capita, male: Total alcohol per capita consumption is defined as the total (sum of recorded and unrecorded alcohol) amount of alcohol consumed per person (15 years of age or older) over a calendar year, in litres of pure alcohol, adjusted for tourist consumption.
Source
World Health Organization, Global Health Observatory Data Repository (http://apps.who.int/ghodata/).
Google Earth
-
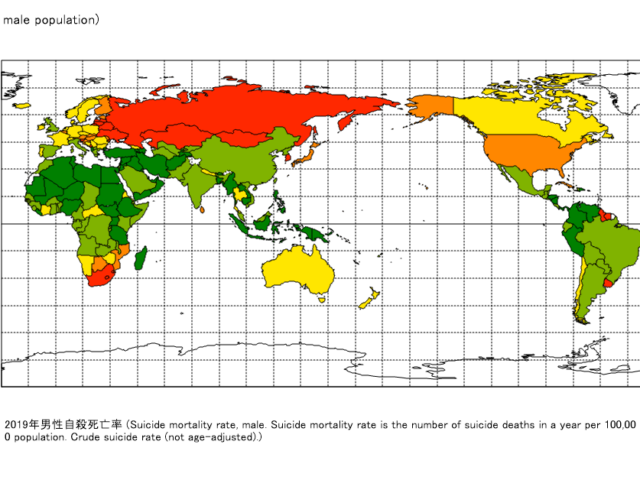
2019年男性自殺死亡率
Title
Suicide mortality rate, male. Suicide mortality rate is the number of suicide deaths in a year per 100,000 population. Crude suicide rate (not age-adjusted).
Source
World Health Organization, Global Health Observatory Data Repository (http://apps.who.int/ghodata/).
Google Earth
-
2019年女性1人当たりの総アルコール消費量
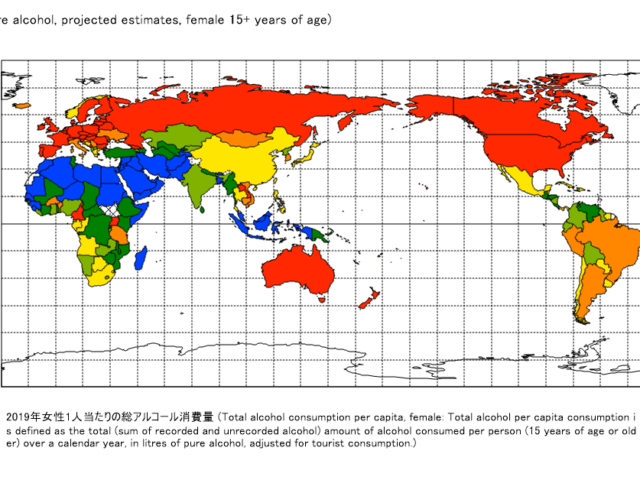
Title
Total alcohol consumption per capita, female: Total alcohol per capita consumption is defined as the total (sum of recorded and unrecorded alcohol) amount of alcohol consumed per person (15 years of age or older) over a calendar year, in litres of pure alcohol, adjusted for tourist consumption.
Source
World Health Organization, Global Health Observatory Data Repository (http://apps.who.int/ghodata/).
Google Earth
-
既婚女性に夫への服従を求める法的規定の有無
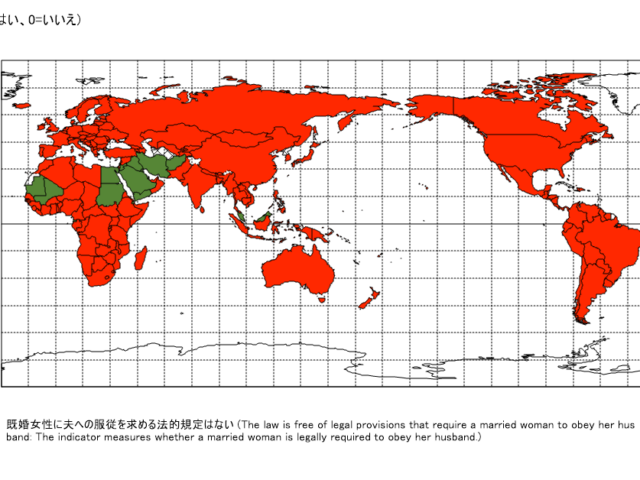
Title
The law is free of legal provisions that require a married woman to obey her husband: The indicator measures whether a married woman is legally required to obey her husband.
Source
World Bank: Women, Business and the Law (https://wbl.worldbank.org/) tracks progress toward legal equality between men and women in 190 economies. Data are collected with standardized questionnaires to ensure comparability across economies. Questionnaires are administered to over 2,000 respondents with expertise in family, labor, and violence against women legislation, including lawyers, judges, academics, and members of civil society organizations working on gender issues. Respondents provide responses to the questionnaires and references to relevant laws and regulations. The Women, Business and the Law team collects the texts of these codified sources of national law – constitutions, codes, laws, statutes, rules, regulations, and procedures – and checks questionnaire responses for accuracy. Thirty-five data points are scored across eight indicators of four or five binary questions, with each indicator representing a different phase of a woman's career. Indicator-level scores are obtained by calculating the unweighted average of the questions within that indicator and scaling the result to 100. Overall scores are then calculated by taking the average of each indicator, with 100 representing the highest possible score.
Google Earth
-
2019年女性自殺死亡率
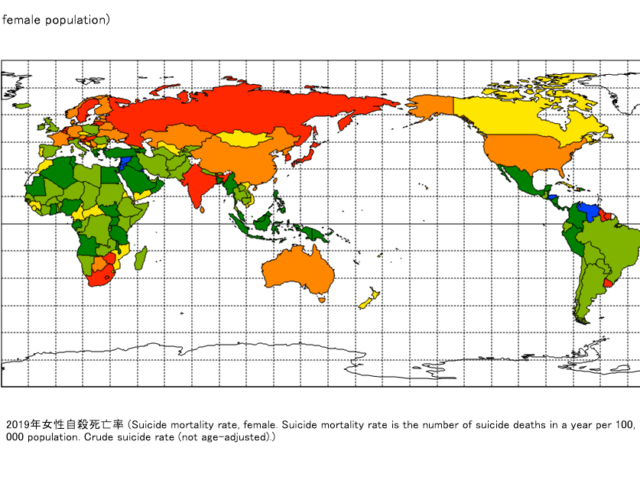
Title
Suicide mortality rate, female. Suicide mortality rate is the number of suicide deaths in a year per 100,000 population. Crude suicide rate (not age-adjusted).
Source
World Health Organization, Global Health Observatory Data Repository (http://apps.who.int/ghodata/).
Google Earth
-
女性は男性と同様に国外旅行ができるか
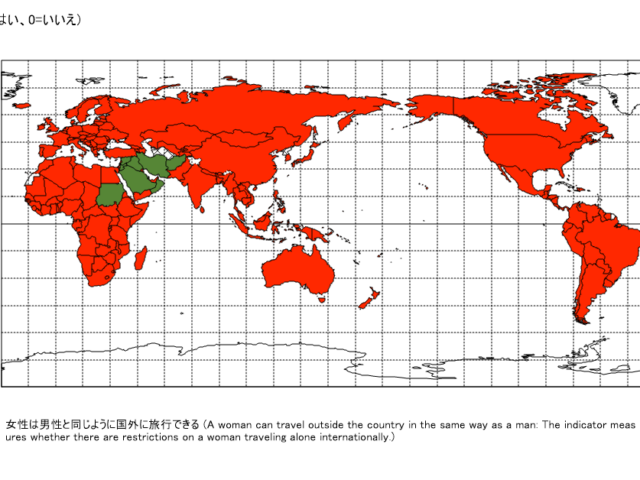
Title
A woman can travel outside the country in the same way as a man: The indicator measures whether there are restrictions on a woman traveling alone internationally.
Source
World Bank: Women, Business and the Law (https://wbl.worldbank.org/) tracks progress toward legal equality between men and women in 190 economies. Data are collected with standardized questionnaires to ensure comparability across economies. Questionnaires are administered to over 2,000 respondents with expertise in family, labor, and violence against women legislation, including lawyers, judges, academics, and members of civil society organizations working on gender issues. Respondents provide responses to the questionnaires and references to relevant laws and regulations. The Women, Business and the Law team collects the texts of these codified sources of national law – constitutions, codes, laws, statutes, rules, regulations, and procedures – and checks questionnaire responses for accuracy. Thirty-five data points are scored across eight indicators of four or five binary questions, with each indicator representing a different phase of a woman's career. Indicator-level scores are obtained by calculating the unweighted average of the questions within that indicator and scaling the result to 100. Overall scores are then calculated by taking the average of each indicator, with 100 representing the highest possible score.
Google Earth
-
女性は男性と同様のプロセスで離婚判決を得ることができるか
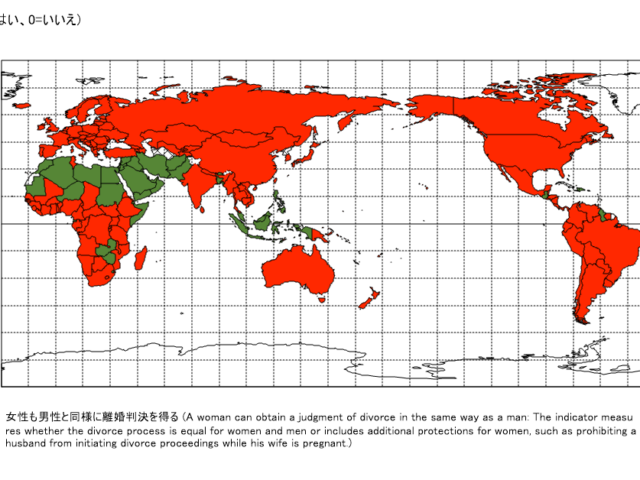
Title
A woman can obtain a judgment of divorce in the same way as a man: The indicator measures whether the divorce process is equal for women and men or includes additional protections for women, such as prohibiting a husband from initiating divorce proceedings while his wife is pregnant.
Source
World Bank: Women, Business and the Law (https://wbl.worldbank.org/) tracks progress toward legal equality between men and women in 190 economies. Data are collected with standardized questionnaires to ensure comparability across economies. Questionnaires are administered to over 2,000 respondents with expertise in family, labor, and violence against women legislation, including lawyers, judges, academics, and members of civil society organizations working on gender issues. Respondents provide responses to the questionnaires and references to relevant laws and regulations. The Women, Business and the Law team collects the texts of these codified sources of national law – constitutions, codes, laws, statutes, rules, regulations, and procedures – and checks questionnaire responses for accuracy. Thirty-five data points are scored across eight indicators of four or five binary questions, with each indicator representing a different phase of a woman's career. Indicator-level scores are obtained by calculating the unweighted average of the questions within that indicator and scaling the result to 100. Overall scores are then calculated by taking the average of each indicator, with 100 representing the highest possible score.
Google Earth
-
女性は男性と同様に国内旅行ができるか
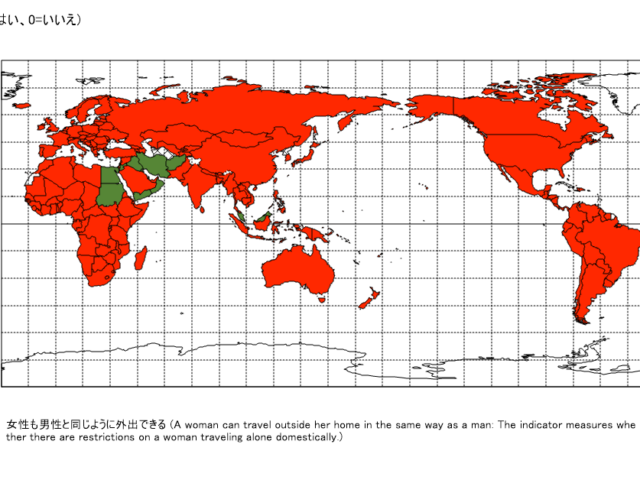
Title
A woman can travel outside her home in the same way as a man: The indicator measures whether there are restrictions on a woman traveling alone domestically.
Source
World Bank: Women, Business and the Law (https://wbl.worldbank.org/) tracks progress toward legal equality between men and women in 190 economies. Data are collected with standardized questionnaires to ensure comparability across economies. Questionnaires are administered to over 2,000 respondents with expertise in family, labor, and violence against women legislation, including lawyers, judges, academics, and members of civil society organizations working on gender issues. Respondents provide responses to the questionnaires and references to relevant laws and regulations. The Women, Business and the Law team collects the texts of these codified sources of national law – constitutions, codes, laws, statutes, rules, regulations, and procedures – and checks questionnaire responses for accuracy. Thirty-five data points are scored across eight indicators of four or five binary questions, with each indicator representing a different phase of a woman's career. Indicator-level scores are obtained by calculating the unweighted average of the questions within that indicator and scaling the result to 100. Overall scores are then calculated by taking the average of each indicator, with 100 representing the highest possible score.
Google Earth
-
女性は男性と同様にパスポート申請ができるか
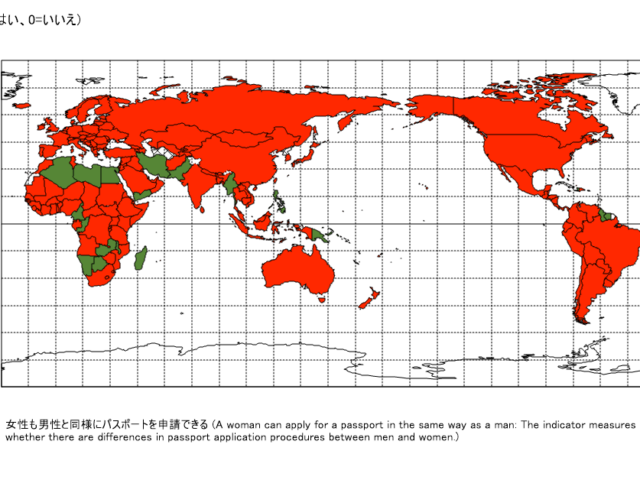
Title
A woman can apply for a passport in the same way as a man: The indicator measures whether there are differences in passport application procedures between men and women.
Source
World Bank: Women, Business and the Law (https://wbl.worldbank.org/) tracks progress toward legal equality between men and women in 190 economies. Data are collected with standardized questionnaires to ensure comparability across economies. Questionnaires are administered to over 2,000 respondents with expertise in family, labor, and violence against women legislation, including lawyers, judges, academics, and members of civil society organizations working on gender issues. Respondents provide responses to the questionnaires and references to relevant laws and regulations. The Women, Business and the Law team collects the texts of these codified sources of national law – constitutions, codes, laws, statutes, rules, regulations, and procedures – and checks questionnaire responses for accuracy. Thirty-five data points are scored across eight indicators of four or five binary questions, with each indicator representing a different phase of a woman's career. Indicator-level scores are obtained by calculating the unweighted average of the questions within that indicator and scaling the result to 100. Overall scores are then calculated by taking the average of each indicator, with 100 representing the highest possible score.
Google Earth
-
女性は男性と同様に住居を選択できるか
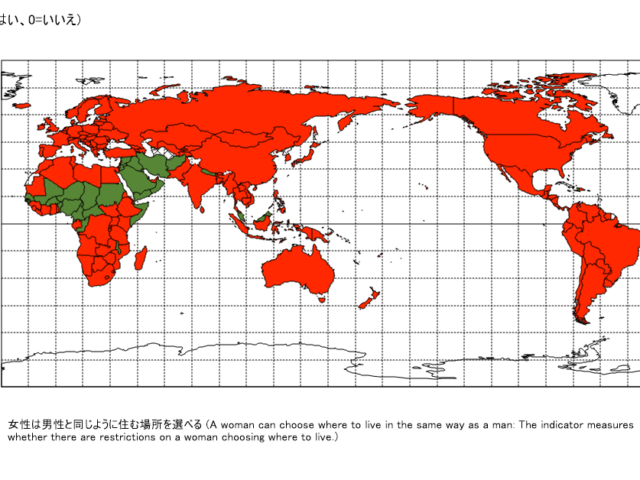
Title
A woman can choose where to live in the same way as a man: The indicator measures whether there are restrictions on a woman choosing where to live.)
Source
World Bank: Women, Business and the Law (https://wbl.worldbank.org/) tracks progress toward legal equality between men and women in 190 economies. Data are collected with standardized questionnaires to ensure comparability across economies. Questionnaires are administered to over 2,000 respondents with expertise in family, labor, and violence against women legislation, including lawyers, judges, academics, and members of civil society organizations working on gender issues. Respondents provide responses to the questionnaires and references to relevant laws and regulations. The Women, Business and the Law team collects the texts of these codified sources of national law – constitutions, codes, laws, statutes, rules, regulations, and procedures – and checks questionnaire responses for accuracy. Thirty-five data points are scored across eight indicators of four or five binary questions, with each indicator representing a different phase of a woman's career. Indicator-level scores are obtained by calculating the unweighted average of the questions within that indicator and scaling the result to 100. Overall scores are then calculated by taking the average of each indicator, with 100 representing the highest possible score.
Google Earth
-
DVを扱う法律の有無
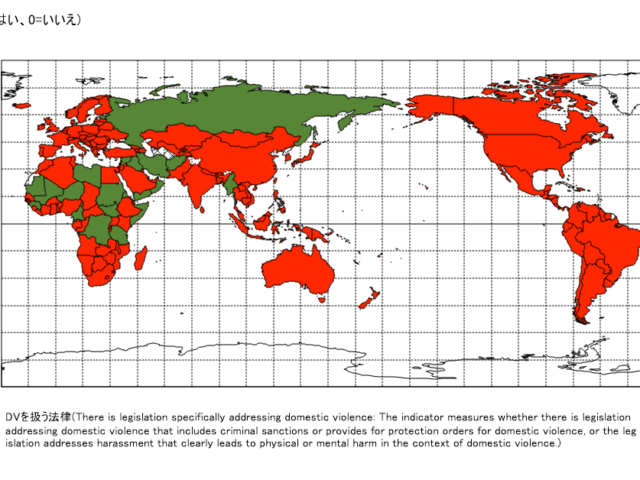
Title
There is legislation specifically addressing domestic violence: The indicator measures whether there is legislation addressing domestic violence that includes criminal sanctions or provides for protection orders for domestic violence, or the legislation addresses harassment that clearly leads to physical or mental harm in the context of domestic violence.
Source
World Bank: Women, Business and the Law (https://wbl.worldbank.org/).
Google Earth
-
過去12カ月間に,現在または過去の親密なパートナーから身体的・性的暴力を受けたことのある女性および少女の割合
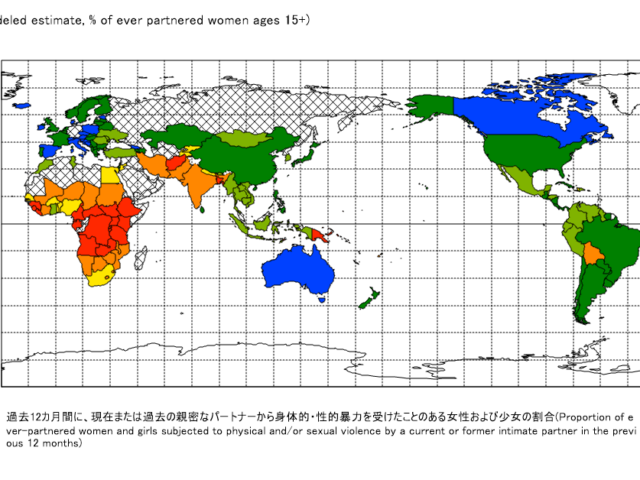
Title
Proportion of ever-partnered women and girls subjected to physical and/or sexual violence by a current or former intimate partner in the previous 12 months
Source
UN WOMEN (https://data.unwomen.org). Source detail: All Surveys and studies that are population-based, representative at the national or sub-national level, conducted between 2000 and 2018 and measured IPV using act-specific questions.
Google Earth
-
雇用におけるセクシャル・ハラスメントに関する法律
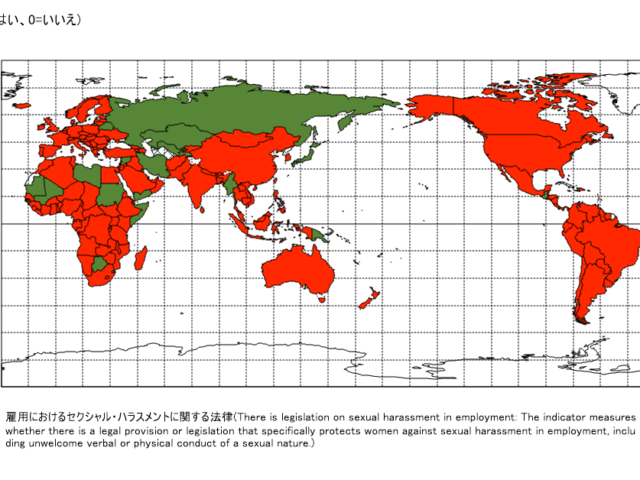
Title
There is legislation on sexual harassment in employment: The indicator measures whether there is a legal provision or legislation that specifically protects women against sexual harassment in employment, including unwelcome verbal or physical conduct of a sexual nature.
Source
World Bank: Women, Business and the Law (https://wbl.worldbank.org/).
Google Earth
-
親密なパートナーからの暴力を経験したことのある女性の割合
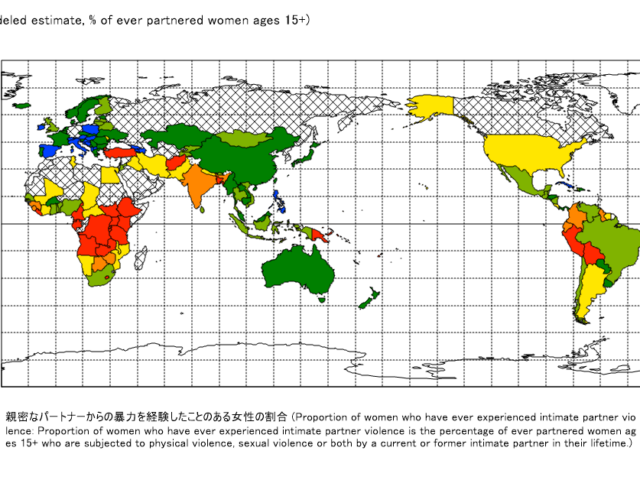
Title
Proportion of women who have ever experienced intimate partner violence: Proportion of women who have ever experienced intimate partner violence is the percentage of ever partnered women ages 15+ who are subjected to physical violence, sexual violence or both by a current or former intimate partner in their lifetime.
Source
DataBank Gender Statistics (https://databank.worldbank.org/). Data resource: The United Nations Inter-Agency Working Group on Violence Against Women Estimation and Data (VAW-IAWGED) (WHO, UN Women, UNICEF, UNSD, UNFPA, UNODC). The United Nations Inter-Agency Working Group on Violence Against Women Estimation and Data (VAW-IAWGED) generated prevalence estimates of intimate partner violence against women and non-partner sexual violence against women using a multilevel regression model.
Google Earth
-
2023年有給出産休暇の期間
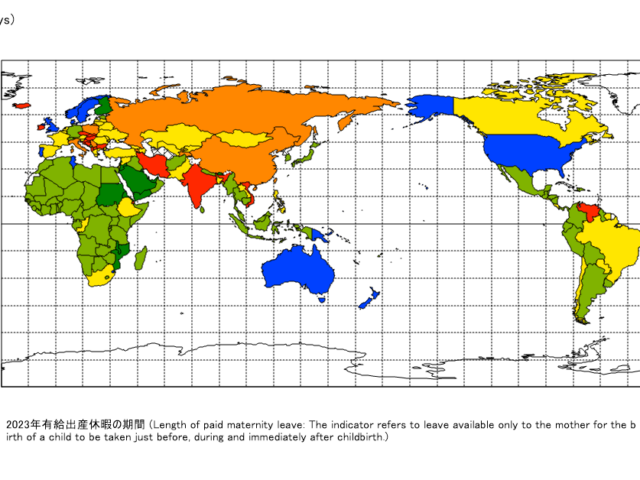
Title
Length of paid maternity leave: The indicator refers to leave available only to the mother for the birth of a child to be taken just before, during and immediately after childbirth.
Source
World Bank: Women, Business and the Law (https://wbl.worldbank.org/) tracks progress toward legal equality between men and women in 190 economies. Data are collected with standardized questionnaires to ensure comparability across economies. Questionnaires are administered to over 2,000 respondents with expertise in family, labor, and violence against women legislation, including lawyers, judges, academics, and members of civil society organizations working on gender issues. Respondents provide responses to the questionnaires and references to relevant laws and regulations. The Women, Business and the Law team collects the texts of these codified sources of national law – constitutions, codes, laws, statutes, rules, regulations, and procedures – and checks questionnaire responses for accuracy. Thirty-five data points are scored across eight indicators of four or five binary questions, with each indicator representing a different phase of a woman's career. Indicator-level scores are obtained by calculating the unweighted average of the questions within that indicator and scaling the result to 100. Overall scores are then calculated by taking the average of each indicator, with 100 representing the highest possible score.
Google Earth
-
法律は同一価値労働に対する男女同一報酬を義務づけているか
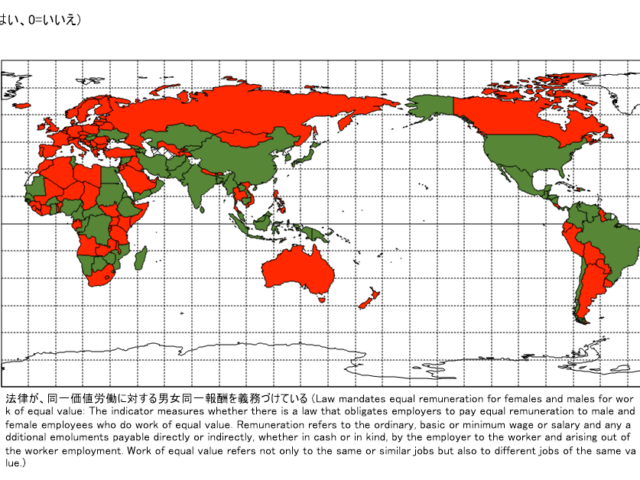
Title
Law mandates equal remuneration for females and males for work of equal value: The indicator measures whether there is a law that obligates employers to pay equal remuneration to male and female employees who do work of equal value. Remuneration refers to the ordinary, basic or minimum wage or salary and any additional emoluments payable directly or indirectly, whether in cash or in kind, by the employer to the worker and arising out of the worker employment. Work of equal value refers not only to the same or similar jobs but also to different jobs of the same value.
Source
World Bank: Women, Business and the Law (https://wbl.worldbank.org/) tracks progress toward legal equality between men and women in 190 economies. Data are collected with standardized questionnaires to ensure comparability across economies. Questionnaires are administered to over 2,000 respondents with expertise in family, labor, and violence against women legislation, including lawyers, judges, academics, and members of civil society organizations working on gender issues. Respondents provide responses to the questionnaires and references to relevant laws and regulations. The Women, Business and the Law team collects the texts of these codified sources of national law – constitutions, codes, laws, statutes, rules, regulations, and procedures – and checks questionnaire responses for accuracy. Thirty-five data points are scored across eight indicators of four or five binary questions, with each indicator representing a different phase of a woman's career. Indicator-level scores are obtained by calculating the unweighted average of the questions within that indicator and scaling the result to 100. Overall scores are then calculated by taking the average of each indicator, with 100 representing the highest possible score.
Google Earth
-
2023年女性が「世帯主」になることへの規制の有無
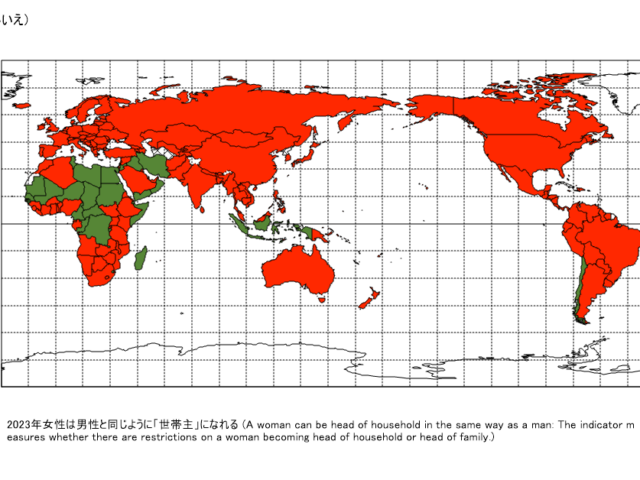
Title
A woman can be head of household in the same way as a man: The indicator measures whether there are restrictions on a woman becoming head of household or head of family.
Source
World Bank: Women, Business and the Law (https://wbl.worldbank.org/) tracks progress toward legal equality between men and women in 190 economies. Data are collected with standardized questionnaires to ensure comparability across economies. Questionnaires are administered to over 2,000 respondents with expertise in family, labor, and violence against women legislation, including lawyers, judges, academics, and members of civil society organizations working on gender issues. Respondents provide responses to the questionnaires and references to relevant laws and regulations. The Women, Business and the Law team collects the texts of these codified sources of national law – constitutions, codes, laws, statutes, rules, regulations, and procedures – and checks questionnaire responses for accuracy. Thirty-five data points are scored across eight indicators of four or five binary questions, with each indicator representing a different phase of a woman's career. Indicator-level scores are obtained by calculating the unweighted average of the questions within that indicator and scaling the result to 100. Overall scores are then calculated by taking the average of each indicator, with 100 representing the highest possible score.
Google Earth
-
2023年妊娠中の労働者の解雇禁止
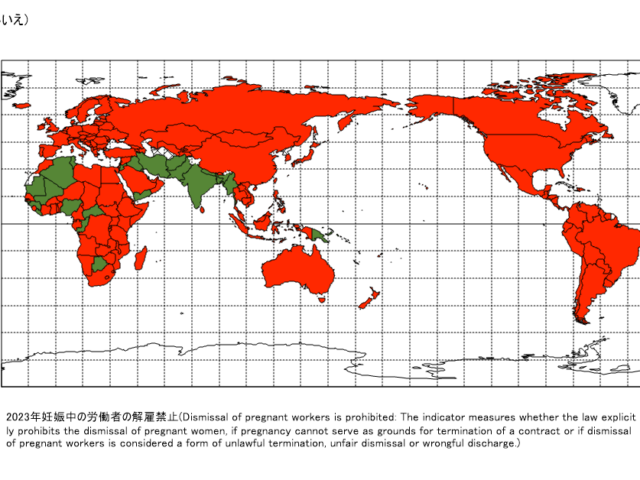
Title
Dismissal of pregnant workers is prohibited: The indicator measures whether the law explicitly prohibits the dismissal of pregnant women, if pregnancy cannot serve as grounds for termination of a contract or if dismissal of pregnant workers is considered a form of unlawful termination, unfair dismissal or wrongful discharge.
Source
World Bank: Women, Business and the Law (https://wbl.worldbank.org/) tracks progress toward legal equality between men and women in 190 economies. Data are collected with standardized questionnaires to ensure comparability across economies. Questionnaires are administered to over 2,000 respondents with expertise in family, labor, and violence against women legislation, including lawyers, judges, academics, and members of civil society organizations working on gender issues. Respondents provide responses to the questionnaires and references to relevant laws and regulations. The Women, Business and the Law team collects the texts of these codified sources of national law – constitutions, codes, laws, statutes, rules, regulations, and procedures – and checks questionnaire responses for accuracy. Thirty-five data points are scored across eight indicators of four or five binary questions, with each indicator representing a different phase of a woman's career. Indicator-level scores are obtained by calculating the unweighted average of the questions within that indicator and scaling the result to 100. Overall scores are then calculated by taking the average of each indicator, with 100 representing the highest possible score.
Google Earth
-
2022年出生時の性比
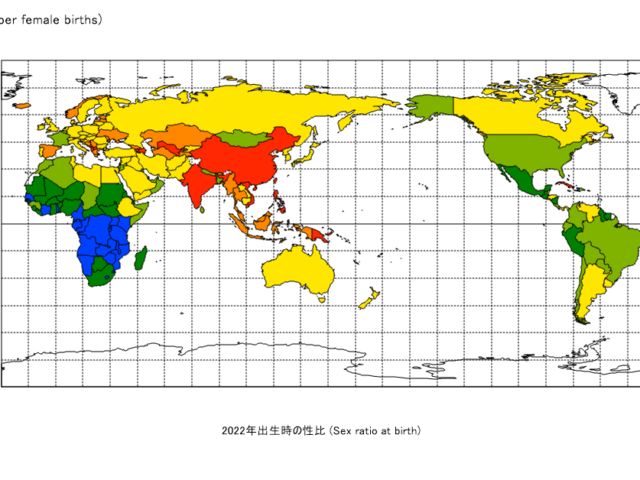
Title
Sex ratio at birth
Source
DataBank Gender Statistics (https://databank.worldbank.org/). Data resource: United Nations Population Division. World Population Prospects: 2022 Revision.
Google Earth
-
2022年結婚と家族における男女平等の法的推進の達成率
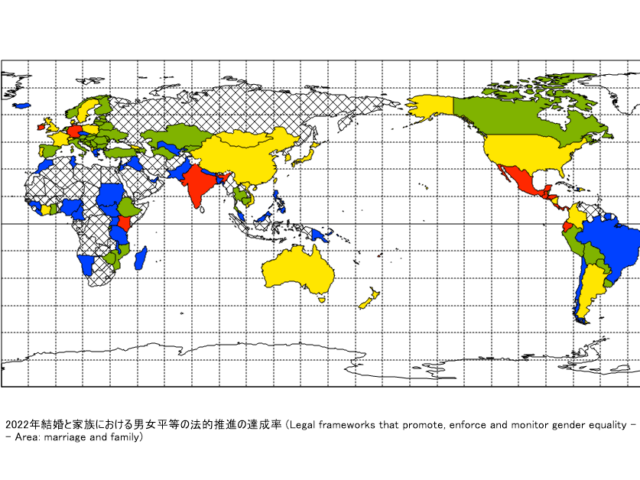
Title
Legal frameworks that promote, enforce and monitor gender equality — Area: marriage and family
Source
UN WOMEN (https://data.unwomen.org). Source detail: Data are derived from an assessment of country’s legal frameworks completed by National Statistical Offices and/or National Women’s Machinery, and legal practitioners/researchers on gender equality, using a questionnaire.
Google Earth
-
2022年経済と雇用における男女平等の法的推進の達成率
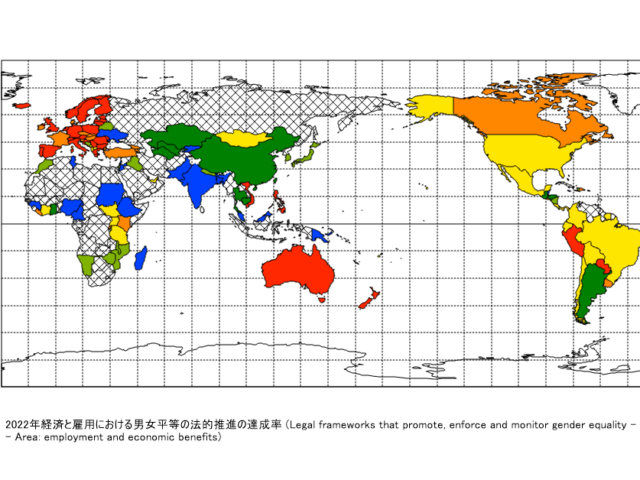
Title
Legal frameworks that promote, enforce and monitor gender equality — Area: employment and economic benefits
Source
UN WOMEN (https://data.unwomen.org). Source detail: Data are derived from an assessment of country’s legal frameworks completed by National Statistical Offices and/or National Women’s Machinery, and legal practitioners/researchers on gender equality, using a questionnaire.
Google Earth
-
2022年女性中等教育以上の教育を受けた人口
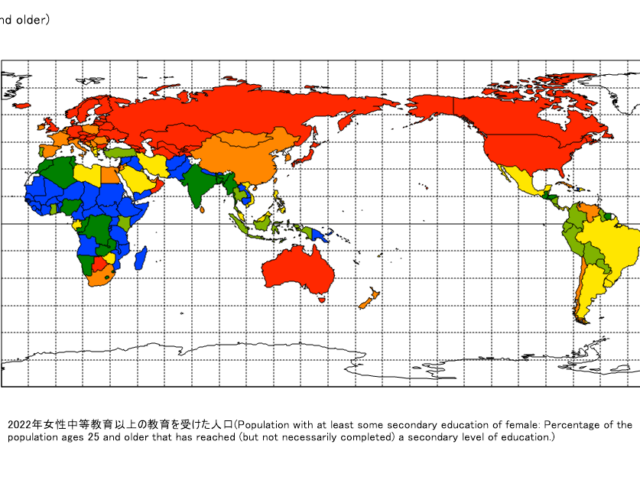
Title
Population with at least some secondary education of female: Percentage of the population ages 25 and older that has reached (but not necessarily completed) a secondary level of education.
Source
UNDP Human Development Report 2022 (https://hdr.undp.org) Main data resources: Barro and Lee (2018), ICF Macro Demographic and Health Surveys, OECD (2023), UNESCO Institute for Statistics (2023) and UNICEF Multiple Indicator Cluster Surveys.
Google Earth
-
2022年女性労働力率
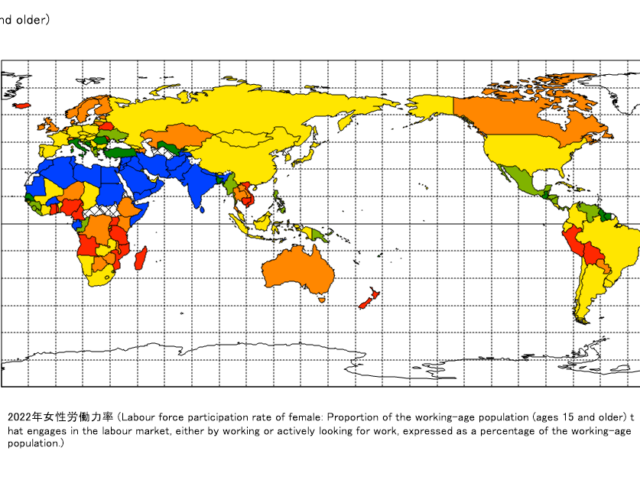
Title
Labour force participation rate of female: Proportion of the working-age population (ages 15 and older) that engages in the labour market, either by working or actively looking for work, expressed as a percentage of the working-age population.
Source
UNDP Human Development Report 2022 (https://hdr.undp.org). Updated by HDRO based on data from International Labour Organization (2023).
Google Earth
-
2022年女性国会議席占有率
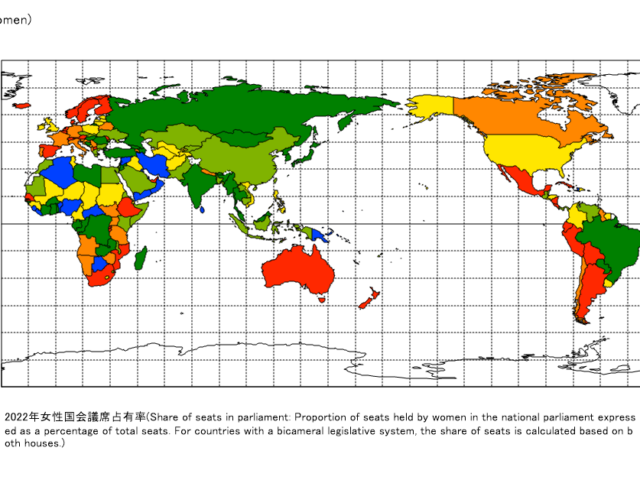
Title
Share of seats in parliament: Proportion of seats held by women in the national parliament expressed as a percentage of total seats. For countries with a bicameral legislative system, the share of seats is calculated based on both houses.
Source
UNDP Human Development Report 2022 (https://hdr.undp.org) Main data resources: IPU (2023).
Google Earth
-
2020年妊産婦死亡率
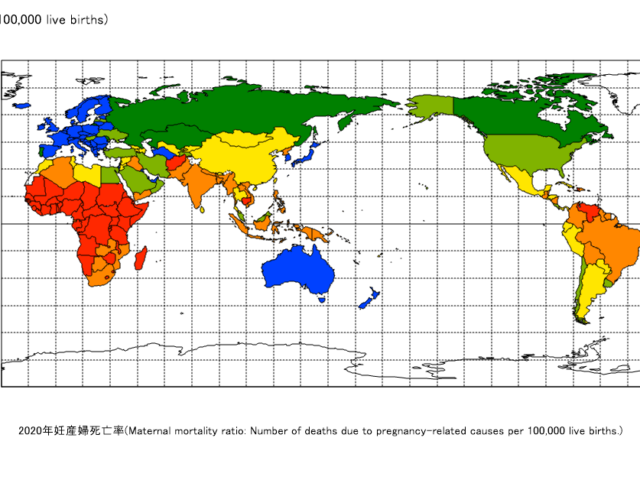
Title
Maternal mortality ratio: Number of deaths due to pregnancy-related causes per 100,000 live births.
Source
UNDP Human Development Report 2022 (https://hdr.undp.org). Main data resources: WHO, UNICEF, UNFPA, World Bank Group and United Nations Population Division (2023).
Google Earth
-
2022年思春期の出生率
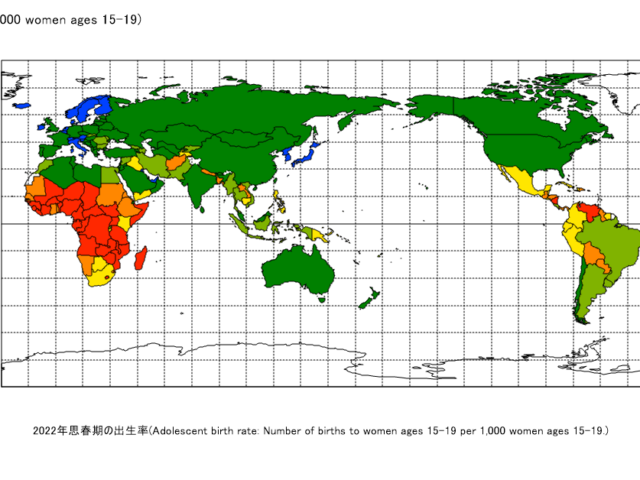
Title
Adolescent birth rate: Number of births to women ages 15?19 per 1,000 women ages 15?19.
Source
UNDP Human Development Report 2022 (https://hdr.undp.org). Main data resources: UNDESA (2022).
Google Earth
-
2022年女性一人当たり国民総所得推計
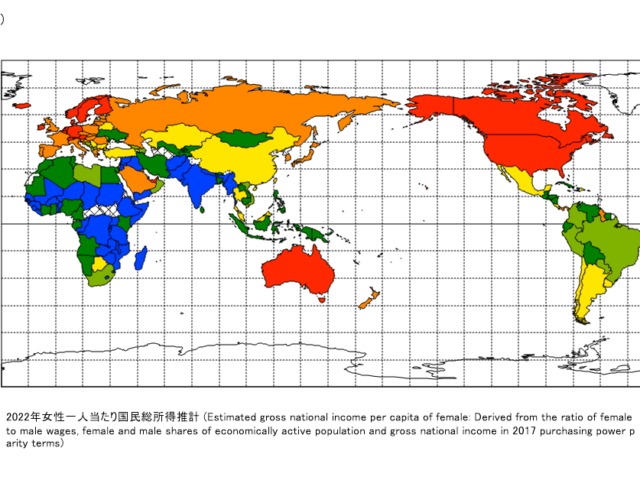
Title
Estimated gross national income per capita of female: Derived from the ratio of female to male wages, female and male shares of economically active population and gross national income in 2017 purchasing power parity terms
Source
UNDP Human Development Report 2022 (https://hdr.undp.org) HDRO calculations based on ILO (2023), IMF (2023), UNDESA (2023), United Nations Statistics Division (2023) and World Bank (2023).
Google Earth
-
2022年ジェンダー不平等指数
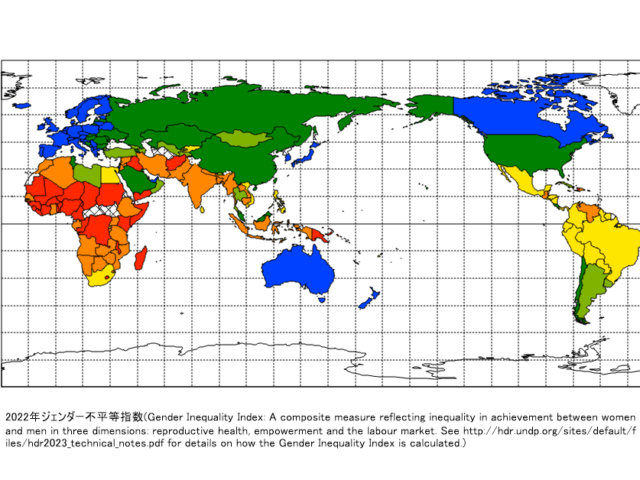
Title
Gender Inequality Index: A composite measure reflecting inequality in achievement between women and men in three dimensions: reproductive health, empowerment and the labour market. See http://hdr.undp.org/sites/default/files/hdr2023_technical_notes.pdf for details on how the Gender Inequality Index is calculated.
Source
UNDP Human Development Report 2022 (https://hdr.undp.org)
Google Earth
-
2022年女性期待修学年数
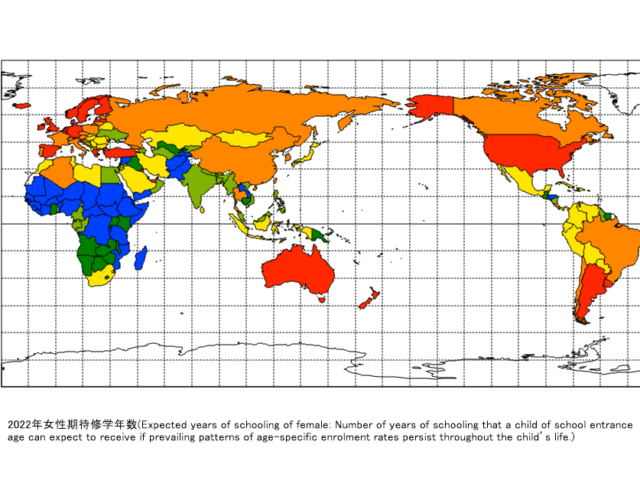
Title
Expected years of schooling of female: Number of years of schooling that a child of school entrance age can expect to receive if prevailing patterns of age-specific enrolment rates persist throughout the child’s life.
Source
UNDP Human Development Report 2022 (https://hdr.undp.org). Main data resources: CEDLAS and The World Bank (2023), ICF Macro Demographic and Health Surveys, UNESCO Institute for Statistics (2023) and UNICEF Multiple Indicator Cluster Surveys. Data refer to 2022 or the most recent year available.
Google Earth
-
2022年女性平均就学年数
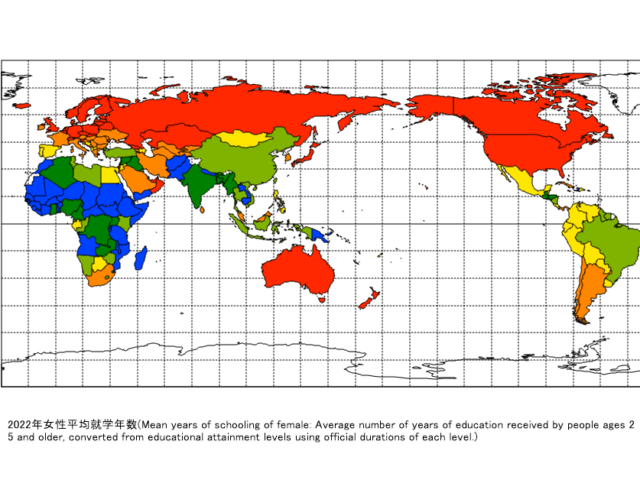
Title
Mean years of schooling of female: Average number of years of education received by people ages 25 and older, converted from educational attainment levels using official durations of each level.
Source
UNDP Human Development Report 2022 (https://hdr.undp.org). Main data resources: Barro and Lee (2018), ICF Macro Demographic and Health Surveys, OECD (2023), UNESCO Institute for Statistics (2023) and UNICEF Multiple Indicator Cluster Surveys.
Google Earth
-
2022年女性出生時の平均余命
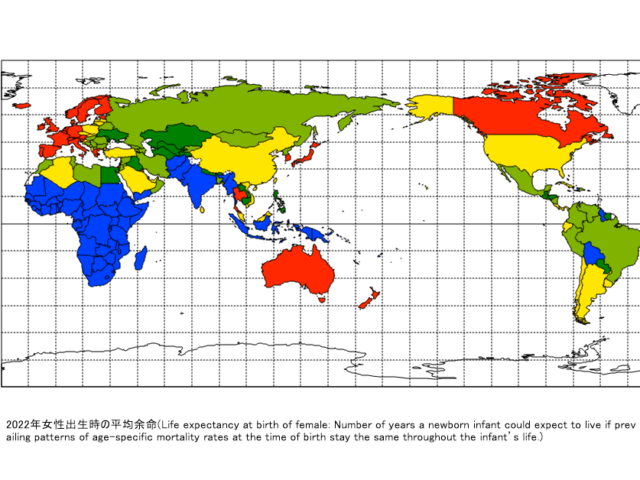
Title
Life expectancy at birth of female: Number of years a newborn infant could expect to live if prevailing patterns of age-specific mortality rates at the time of birth stay the same throughout the infant’s life.
Source
UNDP Human Development Report 2022 (https://hdr.undp.org). Main data resources: UNDESA (2022).
Google Earth
-
2022年ジェンダー開発指数
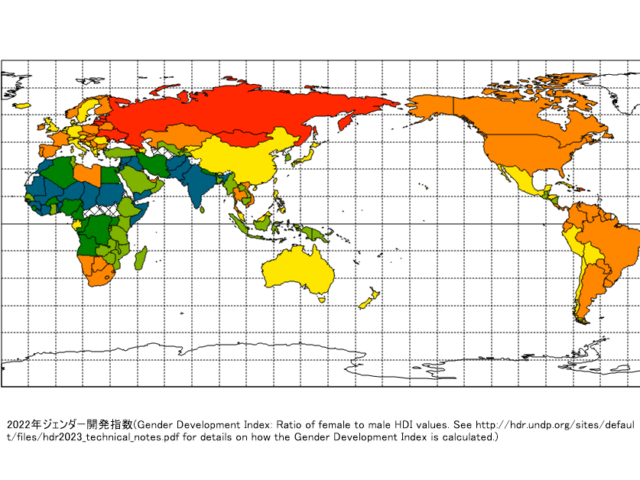
Title
Gender Development Index: Ratio of female to male HDI values. See http://hdr.undp.org/sites/default/files/hdr2023_technical_notes.pdf for details on how the Gender Development Index is calculated.
Source
UNDP Human Development Report 2022 (https://hdr.undp.org). Calculated based on data from Barro and Lee (2018), IMF (2023), UNDESA (2022) (2023), UNESCO Institute for Statistics (2023), United Nations Statistics Division (2023) and World Bank (2023).
Google Earth
多様性 Diversity
Mandara
-
2024年人種的な国の多様性:言語分数化
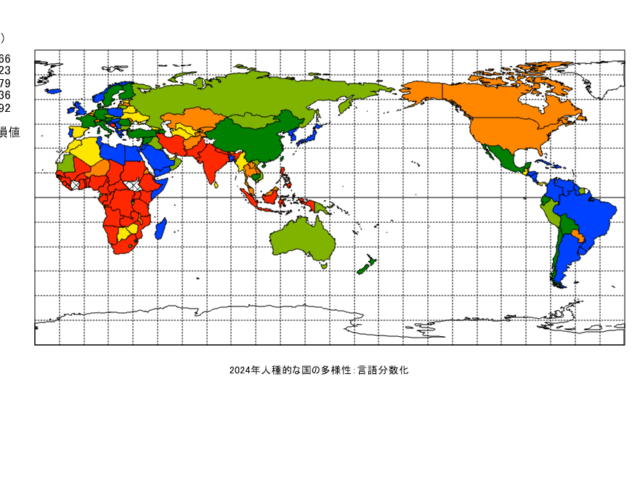
Title
2024 Racial National Diversity: Language Fractionalization
Source
world population review (https://worldpopulationreview.com/country-rankings/most-diverse-countries) source: The most (and least) culturally diverse countries in the world (https://www.pewresearch.org/short-reads/2013/07/18/the-most-and-least-culturally-diverse-countries-in-the-world/). Economic Effects of Domestic and Neighbouring Countries’ Cultural Diversity – Erkan Gören(2013).
Google Earth
-
2024年人種的な国の多様性:宗教分数化
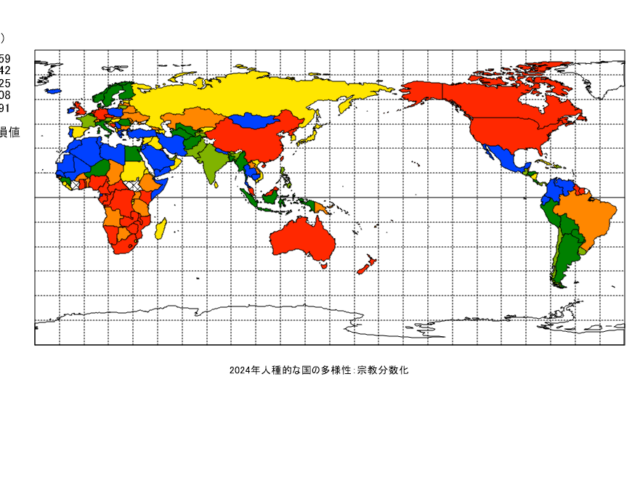
Title
2024 Racial National Diversity: Religious Fractionalization
Source
world population review (https://worldpopulationreview.com/country-rankings/most-diverse-countries) source: The most (and least) culturally diverse countries in the world (https://www.pewresearch.org/short-reads/2013/07/18/the-most-and-least-culturally-diverse-countries-in-the-world/). Economic Effects of Domestic and Neighbouring Countries’ Cultural Diversity – Erkan Gören(2013).
Google Earth
-
2024年人種的な国の多様性:エスニック分数化
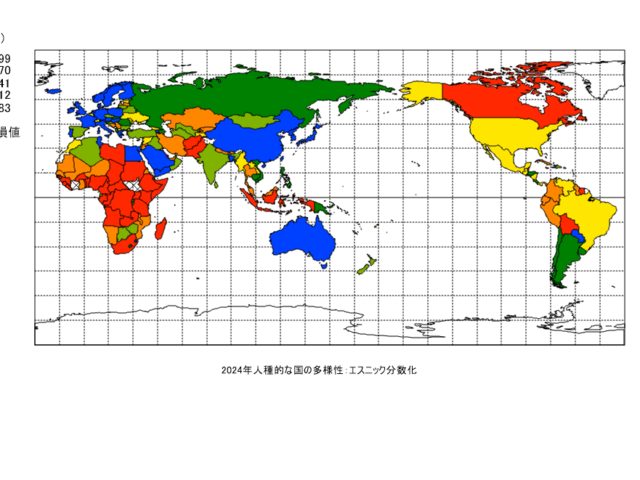
Title
2024 Racial National Diversity: Ethnic Fractionalization
Source
world population review (https://worldpopulationreview.com/country-rankings/most-diverse-countries) source: The most (and least) culturally diverse countries in the world (https://www.pewresearch.org/short-reads/2013/07/18/the-most-and-least-culturally-diverse-countries-in-the-world/). Economic Effects of Domestic and Neighbouring Countries’ Cultural Diversity – Erkan Gören(2013).
Google Earth
-
2020年すべての文化遺産および自然遺産の保護、保全、保全のための一人当たりの総支出額
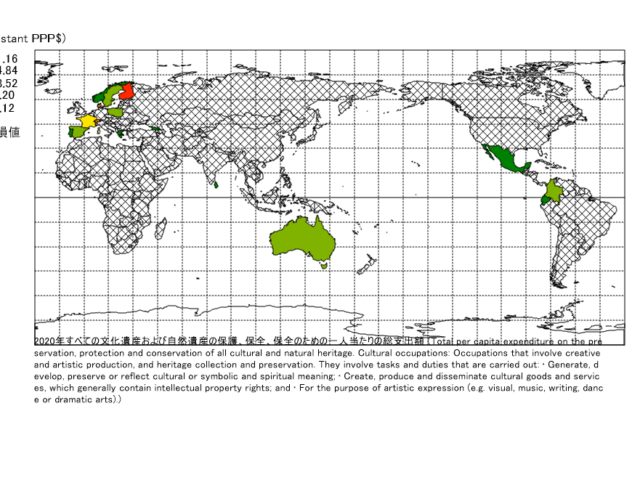
Title
Total per capita expenditure on the preservation, protection and conservation of all cultural and natural heritage. Cultural occupations: Occupations that involve creative and artistic production, and heritage collection and preservation. They involve tasks and duties that are carried out: • Generate, develop, preserve or reflect cultural or symbolic and spiritual meaning; • Create, produce and disseminate cultural goods and services, which generally contain intellectual property rights; and • For the purpose of artistic expression (e.g. visual, music, writing, dance or dramatic arts).
Source
UNESCO Institute for statistics
Google Earth
-
各締約国の世界遺産登録件数

Title
Number of World Heritage properties in each State Party
Source
UNESCO World Heritage Convention States Parties Statistics (https://whc.unesco.org/en/statesparties/stats/#sp7)
Google Earth
-
2015年人口100万人当たりの文化雇用者数
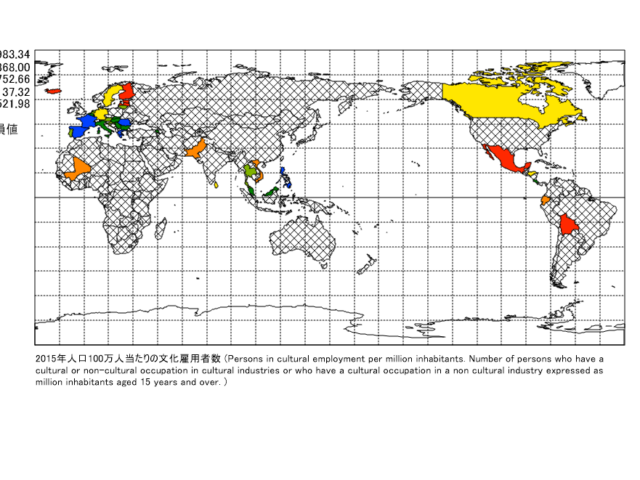
Title
Persons in cultural employment per million inhabitants. Number of persons who have a cultural or non-cultural occupation in cultural industries or who have a cultural occupation in a non cultural industry expressed as million inhabitants aged 15 years and over.
Source
UIS – Questionnaire on cultural employment statistics
Google Earth
-
2015年文化的職業に従事する人の割合
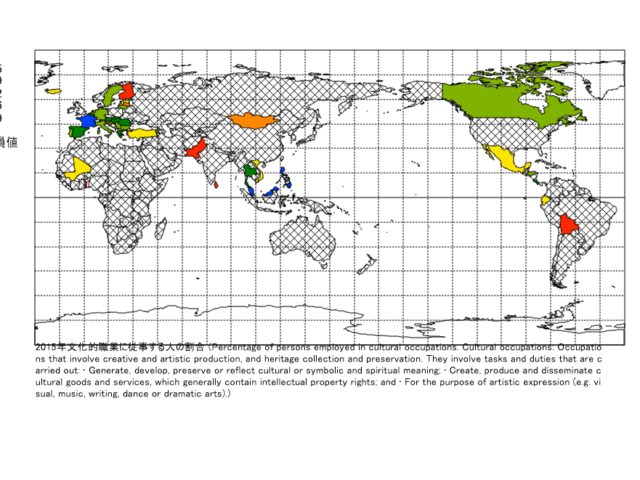
Title
Percentage of persons employed in cultural occupations. Cultural occupations: Occupations that involve creative and artistic production, and heritage collection and preservation. They involve tasks and duties that are carried out: • Generate, develop, preserve or reflect cultural or symbolic and spiritual meaning; • Create, produce and disseminate cultural goods and services, which generally contain intellectual property rights; and • For the purpose of artistic expression (e.g. visual, music, writing, dance or dramatic arts).
Source
UNESCO Institute for Statistics
Google Earth
-
2023年学問の自由度指数
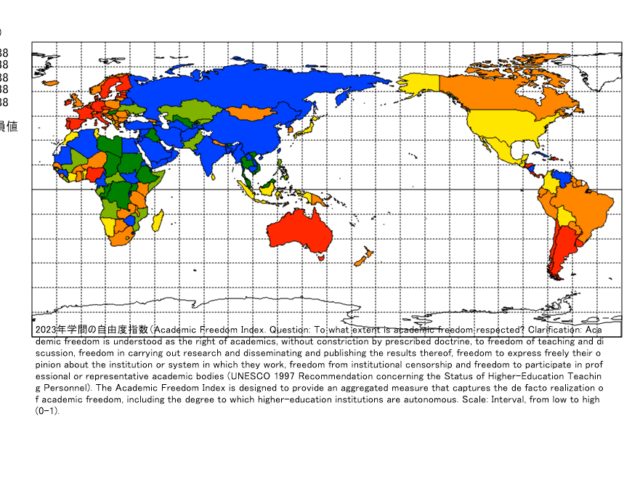
Title
Academic Freedom Index. Question: To what extent is academic freedom respected? Clarification: Academic freedom is understood as the right of academics, without constriction by prescribed doctrine, to freedom of teaching and discussion, freedom in carrying out research and disseminating and publishing the results thereof, freedom to express freely their opinion about the institution or system in which they work, freedom from institutional censorship and freedom to participate in professional or representative academic bodies (UNESCO 1997 Recommendation concerning the Status of Higher-Education Teaching Personnel). The Academic Freedom Index is designed to provide an aggregated measure that captures the de facto realization of academic freedom, including the degree to which higher-education institutions are autonomous. Scale: Interval, from low to high (0-1).
Source
Varieties of Democracy Institute (https://www.v-dem.net/data/the-v-dem-dataset/)
Google Earth
-
2023年表現の自由と情報源の多様性指数
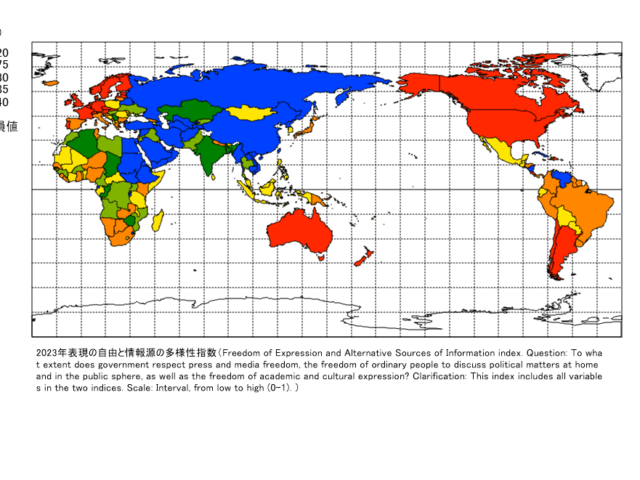
Title
Freedom of Expression and Alternative Sources of Information index. Question: To what extent does government respect press and media freedom, the freedom of ordinary people to discuss political matters at home and in the public sphere, as well as the freedom of academic and cultural expression? Clarification: This index includes all variables in the two indices. Scale: Interval, from low to high (0-1).
Source
Varieties of Democracy Institute (https://www.v-dem.net/data/the-v-dem-dataset/)
Google Earth
人権 Human Right
Mandara
-
障害者の権利に関する条約の選択議定書への批准
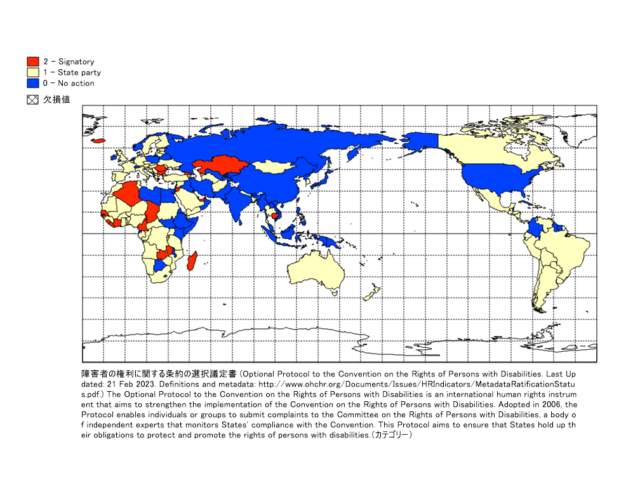
Title
(Optional Protocol to the Convention on the Rights of Persons with Disabilities. Last Updated: 21 Feb 2023. Definitions and metadata: http://www.ohchr.org/Documents/Issues/HRIndicators/MetadataRatificationStatus.pdf.) The Optional Protocol to the Convention on the Rights of Persons with Disabilities is an international human rights instrument that aims to strengthen the implementation of the Convention on the Rights of Persons with Disabilities. Adopted in 2006, the Protocol enables individuals or groups to submit complaints to the Committee on the Rights of Persons with Disabilities, a body of independent experts that monitors States’ compliance with the Convention. This Protocol aims to ensure that States hold up their obligations to protect and promote the rights of persons with disabilities.
Source
Source: Database of the United Nations Office of Legal Affairs (OLA) http://untreaty.un.org/ola
Google Earth
-
国内人権機関の認定の有無
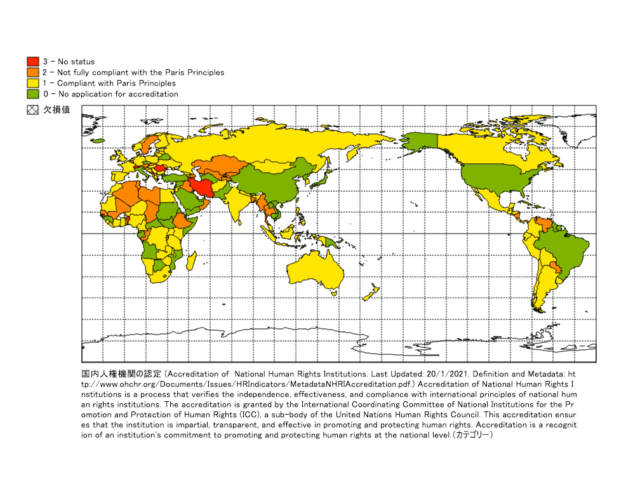
Title
(Accreditation of National Human Rights Institutions. Last Updated: 20/1/2021. Definition and Metadata: http://www.ohchr.org/Documents/Issues/HRIndicators/MetadataNHRIAccreditation.pdf.) Accreditation of National Human Rights Institutions is a process that verifies the independence, effectiveness, and compliance with international principles of national human rights institutions. The accreditation is granted by the International Coordinating Committee of National Institutions for the Promotion and Protection of Human Rights (ICC), a sub-body of the United Nations Human Rights Council. This accreditation ensures that the institution is impartial, transparent, and effective in promoting and protecting human rights. Accreditation is a recognition of an institution’s commitment to promoting and protecting human rights at the national level.
Source
Source : Sub-Committee on Accreditation (SCA) of the Global Alliance of National Human Rights Institutions (GANHRI), Chart of the Status of National Institutions, Chart of the Status of National Institutions, December 2019
Google Earth
-
児童の売買,児童買春および児童ポルノに関する児童の権利に関する条約の選択議定書への批准
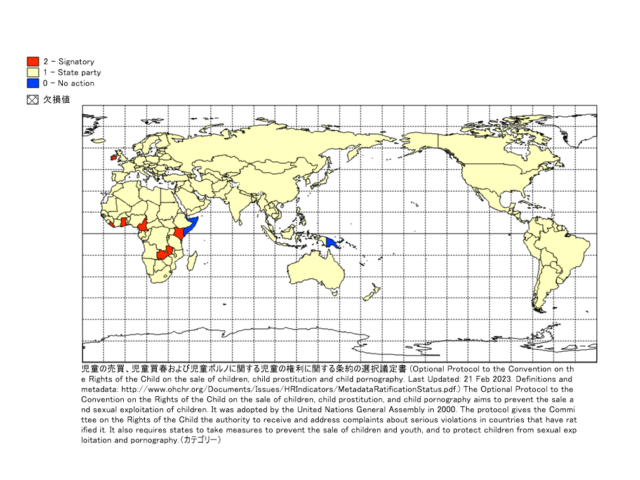
Title
(Optional Protocol to the Convention on the Rights of the Child on the sale of children, child prostitution and child pornography. Last Updated: 21 Feb 2023. Definitions and metadata: http://www.ohchr.org/Documents/Issues/HRIndicators/MetadataRatificationStatus.pdf.) The Optional Protocol to the Convention on the Rights of the Child on the sale of children, child prostitution, and child pornography aims to prevent the sale and sexual exploitation of children. It was adopted by the United Nations General Assembly in 2000. The protocol gives the Committee on the Rights of the Child the authority to receive and address complaints about serious violations in countries that have ratified it. It also requires states to take measures to prevent the sale of children and youth, and to protect children from sexual exploitation and pornography.
Source
Source: Database of the United Nations Office of Legal Affairs (OLA) http://untreaty.un.org/ola
Google Earth
-
通信手続に関する子どもの権利条約選択議定書への批准
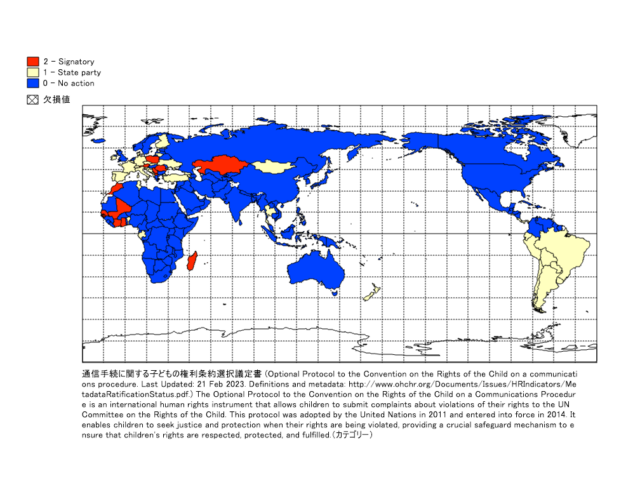
Title
(Optional Protocol to the Convention on the Rights of the Child on a communications procedure. Last Updated: 21 Feb 2023. Definitions and metadata: http://www.ohchr.org/Documents/Issues/HRIndicators/MetadataRatificationStatus.pdf.) The Optional Protocol to the Convention on the Rights of the Child on a Communications Procedure is an international human rights instrument that allows children to submit complaints about violations of their rights to the UN Committee on the Rights of the Child. This protocol was adopted by the United Nations in 2011 and entered into force in 2014. It enables children to seek justice and protection when their rights are being violated, providing a crucial safeguard mechanism to ensure that children’s rights are respected, protected, and fulfilled.
Source
Source: Database of the United Nations Office of Legal Affairs (OLA) http://untreaty.un.org/ola
Google Earth
-
武力紛争における子どもの関与に関する子どもの権利条約の選択議定書への批准
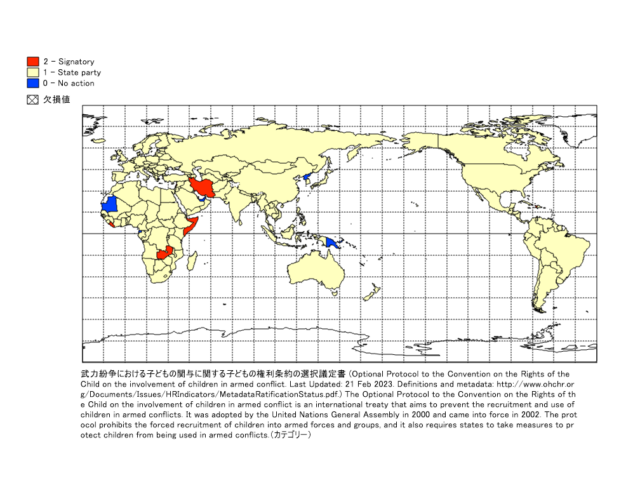
Title
(Optional Protocol to the Convention on the Rights of the Child on the involvement of children in armed conflict. Last Updated: 21 Feb 2023. Definitions and metadata: http://www.ohchr.org/Documents/Issues/HRIndicators/MetadataRatificationStatus.pdf.) The Optional Protocol to the Convention on the Rights of the Child on the involvement of children in armed conflict is an international treaty that aims to prevent the recruitment and use of children in armed conflicts. It was adopted by the United Nations General Assembly in 2000 and came into force in 2002. The protocol prohibits the forced recruitment of children into armed forces and groups, and it also requires states to take measures to protect children from being used in armed conflicts.
Source
Source: Database of the United Nations Office of Legal Affairs (OLA) http://untreaty.un.org/ola
Google Earth
-
女性差別撤廃条約選択議定書への批准
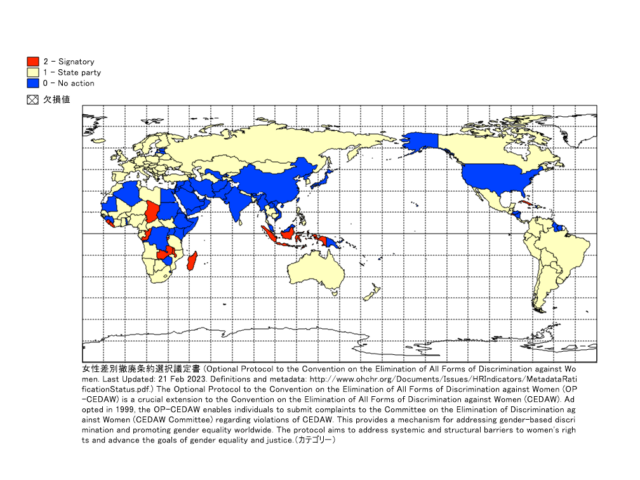
Title
(Optional Protocol to the Convention on the Elimination of All Forms of Discrimination against Women. Last Updated: 21 Feb 2023. Definitions and metadata: http://www.ohchr.org/Documents/Issues/HRIndicators/MetadataRatificationStatus.pdf.) The Optional Protocol to the Convention on the Elimination of All Forms of Discrimination against Women (OP-CEDAW) is a crucial extension to the Convention on the Elimination of All Forms of Discrimination against Women (CEDAW). Adopted in 1999, the OP-CEDAW enables individuals to submit complaints to the Committee on the Elimination of Discrimination against Women (CEDAW Committee) regarding violations of CEDAW. This provides a mechanism for addressing gender-based discrimination and promoting gender equality worldwide. The protocol aims to address systemic and structural barriers to women’s rights and advance the goals of gender equality and justice.
Source
Source: Database of the United Nations Office of Legal Affairs (OLA) http://untreaty.un.org/ola
Google Earth
-
拷問及びその他の残虐な、非人道的な又は品位を傷つける取扱い又は刑罰に関する条約の選択議定書への批准
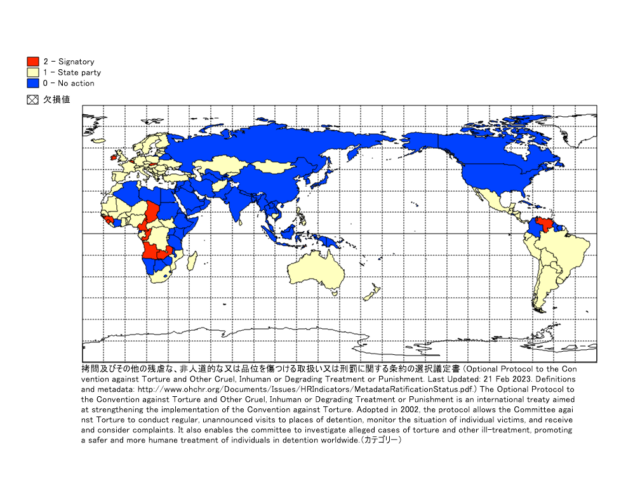
Title
(Optional Protocol to the Convention against Torture and Other Cruel, Inhuman or Degrading Treatment or Punishment. Last Updated: 21 Feb 2023. Definitions and metadata: http://www.ohchr.org/Documents/Issues/HRIndicators/MetadataRatificationStatus.pdf.) The Optional Protocol to the Convention against Torture and Other Cruel, Inhuman or Degrading Treatment or Punishment is an international treaty aimed at strengthening the implementation of the Convention against Torture. Adopted in 2002, the protocol allows the Committee against Torture to conduct regular, unannounced visits to places of detention, monitor the situation of individual victims, and receive and consider complaints. It also enables the committee to investigate alleged cases of torture and other ill-treatment, promoting a safer and more humane treatment of individuals in detention worldwide.
Source
Source: Database of the United Nations Office of Legal Affairs (OLA) http://untreaty.un.org/ola
Google Earth
-
経済的,社会的及び文化的権利に関する国際規約の選択議定書への批准
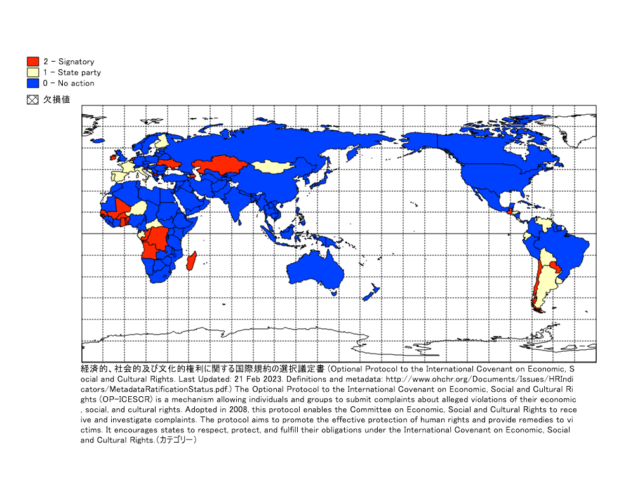
Title
(Optional Protocol to the International Covenant on Economic, Social and Cultural Rights. Last Updated: 21 Feb 2023. Definitions and metadata: http://www.ohchr.org/Documents/Issues/HRIndicators/MetadataRatificationStatus.pdf.) The Optional Protocol to the International Covenant on Economic, Social and Cultural Rights (OP-ICESCR) is a mechanism allowing individuals and groups to submit complaints about alleged violations of their economic, social, and cultural rights. Adopted in 2008, this protocol enables the Committee on Economic, Social and Cultural Rights to receive and investigate complaints. The protocol aims to promote the effective protection of human rights and provide remedies to victims. It encourages states to respect, protect, and fulfill their obligations under the International Covenant on Economic, Social and Cultural Rights.
Source
Source: Database of the United Nations Office of Legal Affairs (OLA) http://untreaty.un.org/ola
Google Earth
-
市民的及び政治的権利に関する国際規約の選択議定書への批准
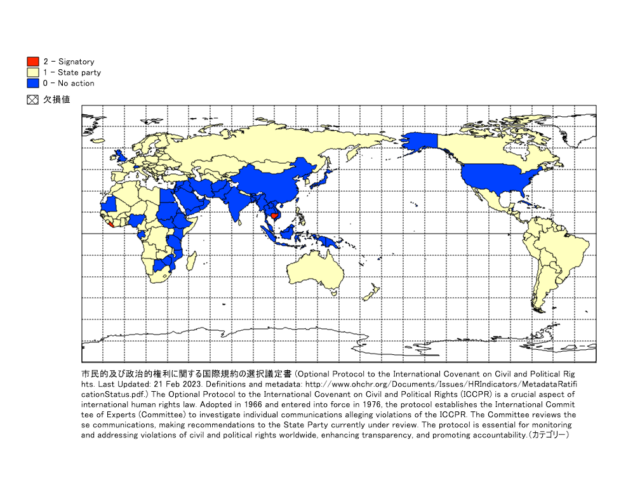
Title
(Optional Protocol to the International Covenant on Civil and Political Rights. Last Updated: 21 Feb 2023. Definitions and metadata: http://www.ohchr.org/Documents/Issues/HRIndicators/MetadataRatificationStatus.pdf.) The Optional Protocol to the International Covenant on Civil and Political Rights (ICCPR) is a crucial aspect of international human rights law. Adopted in 1966 and entered into force in 1976, the protocol establishes the International Committee of Experts (Committee) to investigate individual communications alleging violations of the ICCPR. The Committee reviews these communications, making recommendations to the State Party currently under review. The protocol is essential for monitoring and addressing violations of civil and political rights worldwide, enhancing transparency, and promoting accountability.
Source
Source: Database of the United Nations Office of Legal Affairs (OLA) http://untreaty.un.org/ola
Google Earth
-
死刑廃止を目指す市民的及び政治的権利に関する国際規約の第2選択議定書への批准
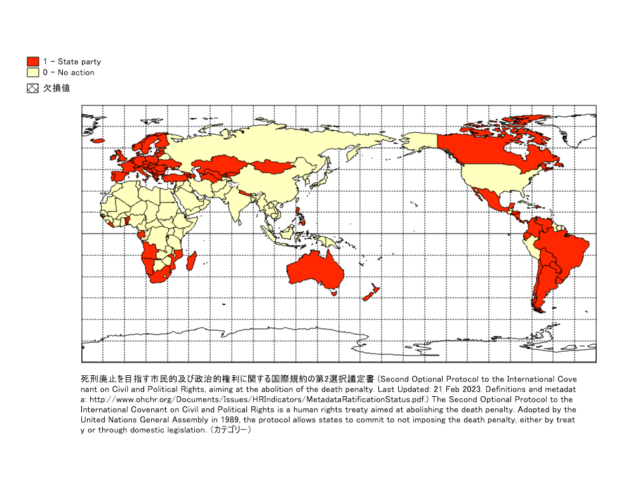
Title
(Second Optional Protocol to the International Covenant on Civil and Political Rights, aiming at the abolition of the death penalty. Last Updated: 21 Feb 2023. Definitions and metadata: http://www.ohchr.org/Documents/Issues/HRIndicators/MetadataRatificationStatus.pdf.) The Second Optional Protocol to the International Covenant on Civil and Political Rights is a human rights treaty aimed at abolishing the death penalty. Adopted by the United Nations General Assembly in 1989, the protocol allows states to commit to not imposing the death penalty, either by treaty or through domestic legislation.
Source
Source: Database of the United Nations Office of Legal Affairs (OLA) http://untreaty.un.org/ola
Google Earth
-
強制失踪からのすべての人の保護のための国際条約への批准
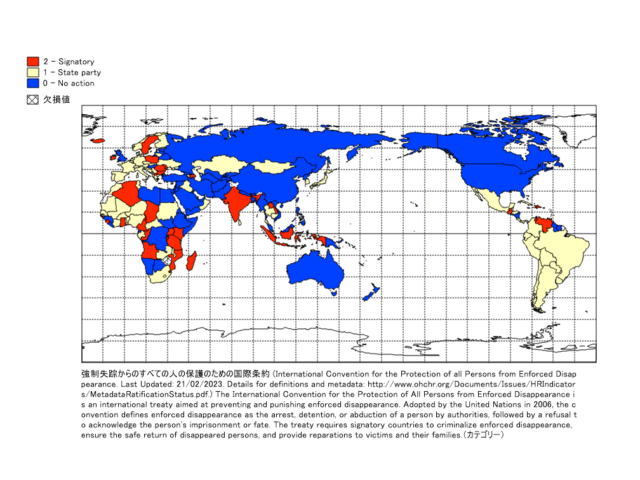
Title
(International Convention for the Protection of all Persons from Enforced Disappearance. Last Updated: 21/02/2023. Details for definitions and metadata: http://www.ohchr.org/Documents/Issues/HRIndicators/MetadataRatificationStatus.pdf.) The International Convention for the Protection of All Persons from Enforced Disappearance is an international treaty aimed at preventing and punishing enforced disappearance. Adopted by the United Nations in 2006, the convention defines enforced disappearance as the arrest, detention, or abduction of a person by authorities, followed by a refusal to acknowledge the person’s imprisonment or fate. The treaty requires signatory countries to criminalize enforced disappearance, ensure the safe return of disappeared persons, and provide reparations to victims and their families.
Source
Source: Database of the United Nations Office of Legal Affairs (OLA) http://untreaty.un.org/ola
Google Earth
-
障害者の権利に関する条約への批准
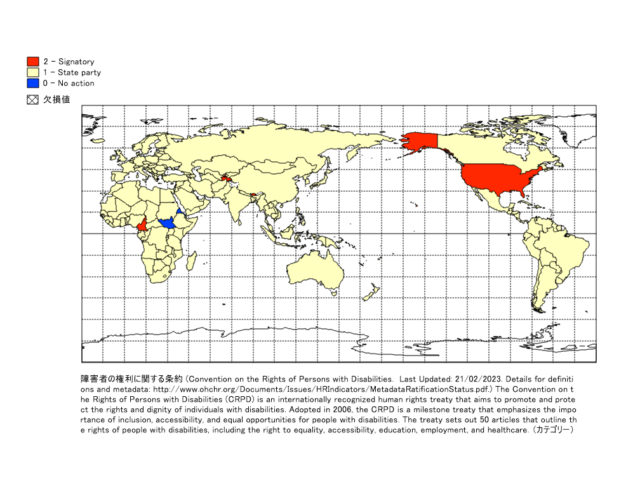
Title
(Convention on the Rights of Persons with Disabilities. Last Updated: 21/02/2023. Details for definitions and metadata: http://www.ohchr.org/Documents/Issues/HRIndicators/MetadataRatificationStatus.pdf.) The Convention on the Rights of Persons with Disabilities (CRPD) is an internationally recognized human rights treaty that aims to promote and protect the rights and dignity of individuals with disabilities. Adopted in 2006, the CRPD is a milestone treaty that emphasizes the importance of inclusion, accessibility, and equal opportunities for people with disabilities. The treaty sets out 50 articles that outline the rights of people with disabilities, including the right to equality, accessibility, education, employment, and healthcare.
Source
Source: Database of the United Nations Office of Legal Affairs (OLA) http://untreaty.un.org/ola
Google Earth
-
すべての移住労働者及びその家族の権利の保護に関する国際条約への批准
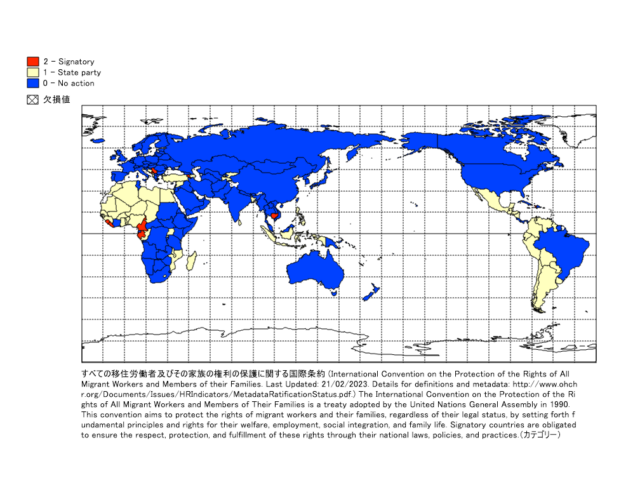
Title
(International Convention on the Protection of the Rights of All Migrant Workers and Members of their Families. Last Updated: 21/02/2023. Details for definitions and metadata: http://www.ohchr.org/Documents/Issues/HRIndicators/MetadataRatificationStatus.pdf.) The International Convention on the Protection of the Rights of All Migrant Workers and Members of Their Families is a treaty adopted by the United Nations General Assembly in 1990. This convention aims to protect the rights of migrant workers and their families, regardless of their legal status, by setting forth fundamental principles and rights for their welfare, employment, social integration, and family life. Signatory countries are obligated to ensure the respect, protection, and fulfillment of these rights through their national laws, policies, and practices.
Source
Source: Database of the United Nations Office of Legal Affairs (OLA) http://untreaty.un.org/ola
Google Earth
-
拷問及び他の残虐な、非人道的な又は品位を傷つける取り扱い又は刑罰に関する条約への批准
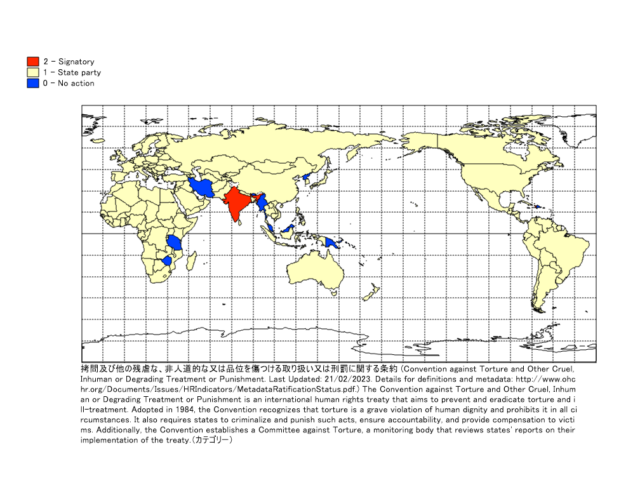
Title
(Convention against Torture and Other Cruel, Inhuman or Degrading Treatment or Punishment. Last Updated: 21/02/2023. Details for definitions and metadata: http://www.ohchr.org/Documents/Issues/HRIndicators/MetadataRatificationStatus.pdf.) The Convention against Torture and Other Cruel, Inhuman or Degrading Treatment or Punishment is an international human rights treaty that aims to prevent and eradicate torture and ill-treatment. Adopted in 1984, the Convention recognizes that torture is a grave violation of human dignity and prohibits it in all circumstances. It also requires states to criminalize and punish such acts, ensure accountability, and provide compensation to victims. Additionally, the Convention establishes a Committee against Torture, a monitoring body that reviews states’ reports on their implementation of the treaty.
Source
Source: Database of the United Nations Office of Legal Affairs (OLA) http://untreaty.un.org/ola
Google Earth
-
子どもの権利条約への批准
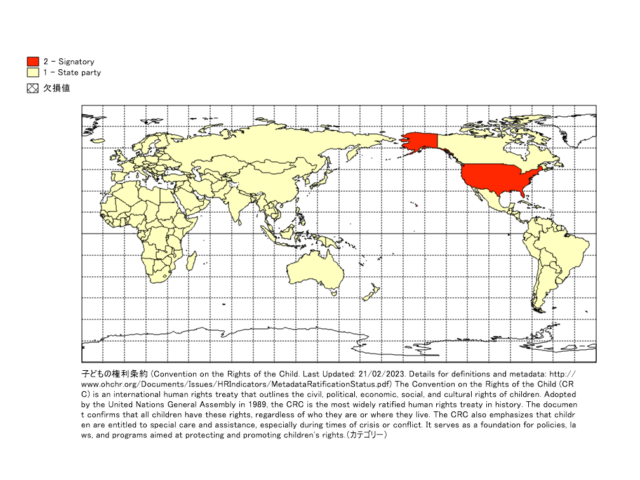
Title
(Convention on the Rights of the Child. Last Updated: 21/02/2023. Details for definitions and metadata: http://www.ohchr.org/Documents/Issues/HRIndicators/MetadataRatificationStatus.pdf) The Convention on the Rights of the Child (CRC) is an international human rights treaty that outlines the civil, political, economic, social, and cultural rights of children. Adopted by the United Nations General Assembly in 1989, the CRC is the most widely ratified human rights treaty in history. The document confirms that all children have these rights, regardless of who they are or where they live. The CRC also emphasizes that children are entitled to special care and assistance, especially during times of crisis or conflict. It serves as a foundation for policies, laws, and programs aimed at protecting and promoting children’s rights.
Source
Source: Database of the United Nations Office of Legal Affairs (OLA) http://untreaty.un.org/ola
Google Earth
-
女性差別撤廃条約への批准
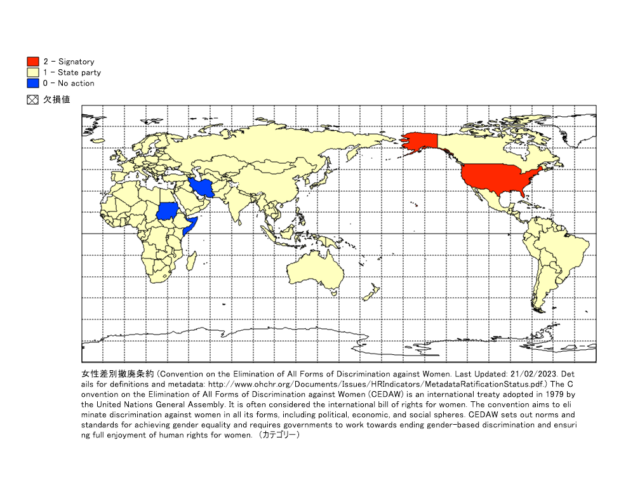
Title
(Convention on the Elimination of All Forms of Discrimination against Women. Last Updated: 21/02/2023. Details for definitions and metadata: http://www.ohchr.org/Documents/Issues/HRIndicators/MetadataRatificationStatus.pdf.) The Convention on the Elimination of All Forms of Discrimination against Women (CEDAW) is an international treaty adopted in 1979 by the United Nations General Assembly. It is often considered the international bill of rights for women. The convention aims to eliminate discrimination against women in all its forms, including political, economic, and social spheres. CEDAW sets out norms and standards for achieving gender equality and requires governments to work towards ending gender-based discrimination and ensuring full enjoyment of human rights for women.
Source
Source: Database of the United Nations Office of Legal Affairs (OLA) http://untreaty.un.org/ola
Google Earth
-
市民的及び政治的権利に関する国際規約への批准
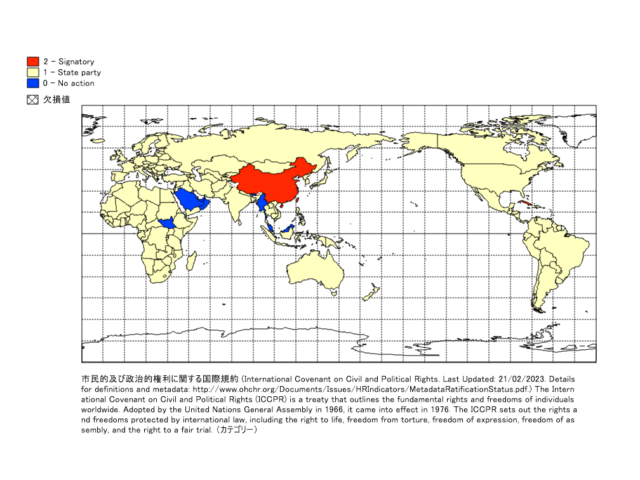
Title
(International Covenant on Civil and Political Rights. Last Updated: 21/02/2023. Details for definitions and metadata: http://www.ohchr.org/Documents/Issues/HRIndicators/MetadataRatificationStatus.pdf.) The International Covenant on Civil and Political Rights (ICCPR) is a treaty that outlines the fundamental rights and freedoms of individuals worldwide. Adopted by the United Nations General Assembly in 1966, it came into effect in 1976. The ICCPR sets out the rights and freedoms protected by international law, including the right to life, freedom from torture, freedom of expression, freedom of assembly, and the right to a fair trial.
Source
Source: Database of the United Nations Office of Legal Affairs (OLA) http://untreaty.un.org/ola
Google Earth
-
経済的,社会的,文化的権利に関する国際規約への批准
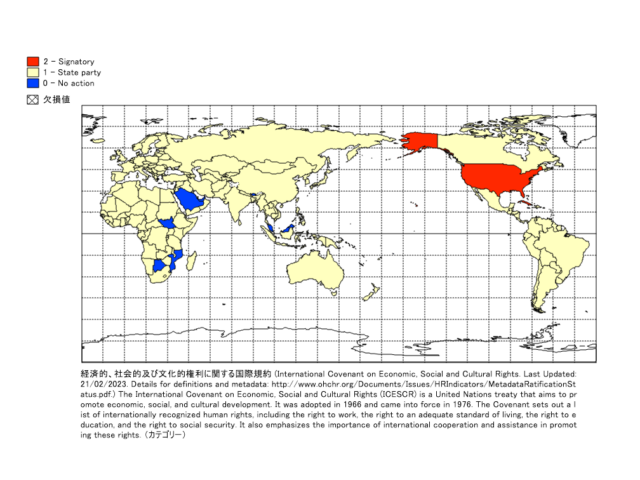
Title
(International Covenant on Economic, Social and Cultural Rights. Last Updated: 21/02/2023. Details for definitions and metadata: http://www.ohchr.org/Documents/Issues/HRIndicators/MetadataRatificationStatus.pdf.) The International Covenant on Economic, Social and Cultural Rights (ICESCR) is a United Nations treaty that aims to promote economic, social, and cultural development. It was adopted in 1966 and came into force in 1976. The Covenant sets out a list of internationally recognized human rights, including the right to work, the right to an adequate standard of living, the right to education, and the right to social security. It also emphasizes the importance of international cooperation and assistance in promoting these rights.
Source
Source: Database of the United Nations Office of Legal Affairs (OLA) http://untreaty.un.org/ola
Google Earth
-
18ある国際人権条約への批准数
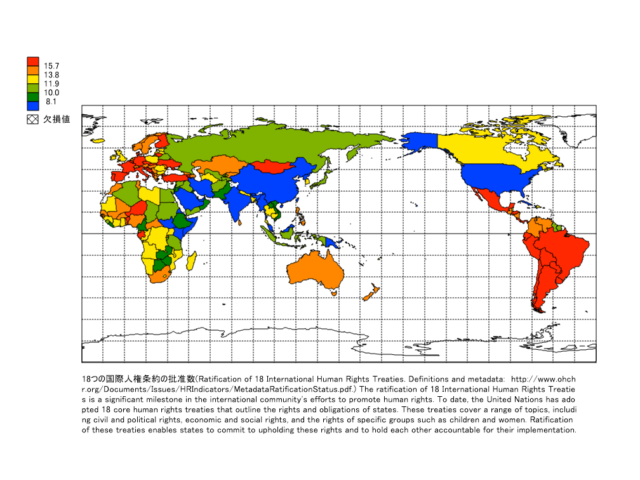
Title
Ratification of 18 International Human Rights Treaties.
Source
Definitions and metadata: http://www.ohchr.org/Documents/Issues/HRIndicators/MetadataRatificationStatus.pdf.) The ratification of 18 International Human Rights Treaties is a significant milestone in the international community’s efforts to promote human rights. To date, the United Nations has adopted 18 core human rights treaties that outline the rights and obligations of states. These treaties cover a range of topics, including civil and political rights, economic and social rights, and the rights of specific groups such as children and women. Ratification of these treaties enables states to commit to upholding these rights and to hold each other accountable for their implementation.
Google Earth
-
あらゆる形態の人種差別の撤廃に関する国際条約への批准
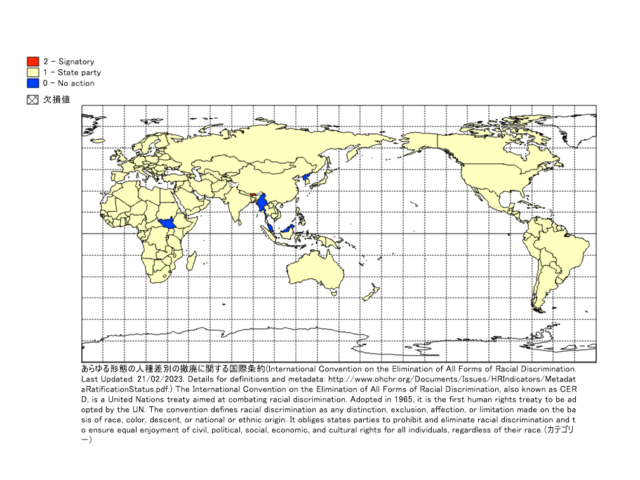
Title
(International Convention on the Elimination of All Forms of Racial Discrimination. Last Updated: 21/02/2023. Details for definitions and metadata: http://www.ohchr.org/Documents/Issues/HRIndicators/MetadataRatificationStatus.pdf.) The International Convention on the Elimination of All Forms of Racial Discrimination, also known as CERD, is a United Nations treaty aimed at combating racial discrimination. Adopted in 1965, it is the first human rights treaty to be adopted by the UN. The convention defines racial discrimination as any distinction, exclusion, affection, or limitation made on the basis of race, color, descent, or national or ethnic origin. It obliges states parties to prohibit and eliminate racial discrimination and to ensure equal enjoyment of civil, political, social, economic, and cultural rights for all individuals, regardless of their race.
Source
Source: Database of the United Nations Office of Legal Affairs (OLA) http://untreaty.un.org/ola
Google Earth
平等 Equity
Mandara
-
2023年平等主義の原則はどれほど達成されているか(0から1の指数)
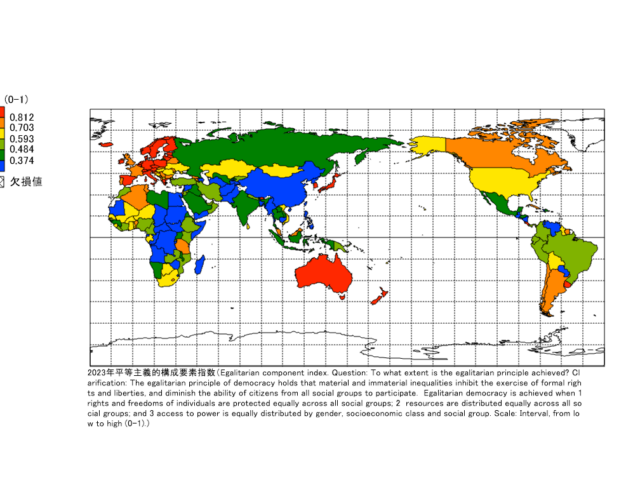
Title
Egalitarian component index. Question: To what extent is the egalitarian principle achieved? Clarification: The egalitarian principle of democracy holds that material and immaterial inequalities inhibit the exercise of formal rights and liberties, and diminish the ability of citizens from all social groups to participate. Egalitarian democracy is achieved when 1 rights and freedoms of individuals are protected equally across all social groups; 2 resources are distributed equally across all social groups; and 3 access to power is equally distributed by gender, socioeconomic class and social group. Scale: Interval, from low to high (0-1).
Source
Varieties of Democracy Institute (https://www.v-dem.net/data/the-v-dem-dataset/)
Google Earth
-
2023年社会集団間で平等に自由と権利が保護されているか(0から1の指数)
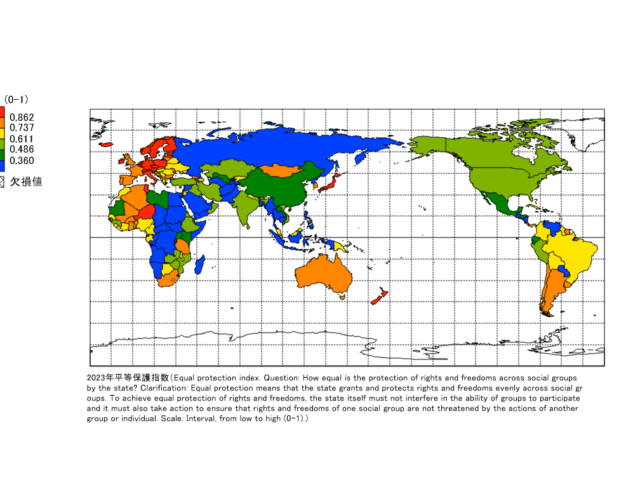
Title
Equal protection index. Question: How equal is the protection of rights and freedoms across social groups by the state? Clarification: Equal protection means that the state grants and protects rights and freedoms evenly across social groups. To achieve equal protection of rights and freedoms, the state itself must not interfere in the ability of groups to participate and it must also take action to ensure that rights and freedoms of one social group are not threatened by the actions of another group or individual. Scale: Interval, from low to high (0-1).
Source
Varieties of Democracy Institute (https://www.v-dem.net/data/the-v-dem-dataset/)
Google Earth
-
2023年法の下の平等と個人の自由(0から1の指数)
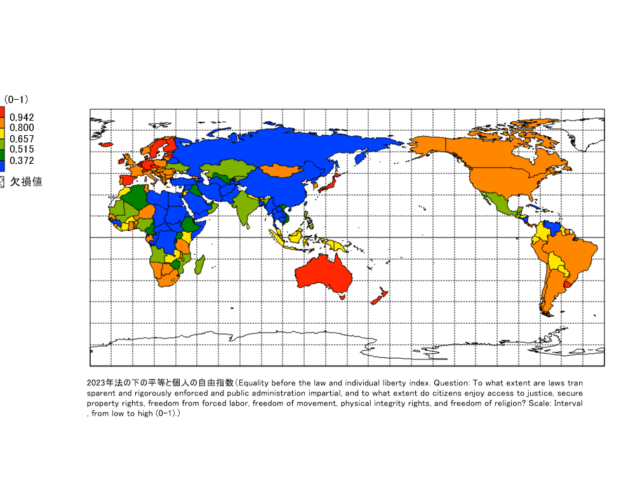
Title
Equality before the law and individual liberty index. Question: To what extent are laws transparent and rigorously enforced and public administration impartial, and to what extent do citizens enjoy access to justice, secure property rights, freedom from forced labor, freedom of movement, physical integrity rights, and freedom of religion? Scale: Interval, from low to high (0-1)
Source
Varieties of Democracy Institute (https://www.v-dem.net/data/the-v-dem-dataset/)
Google Earth
-
2023年権力への平等なアクセス(0から1の指数)
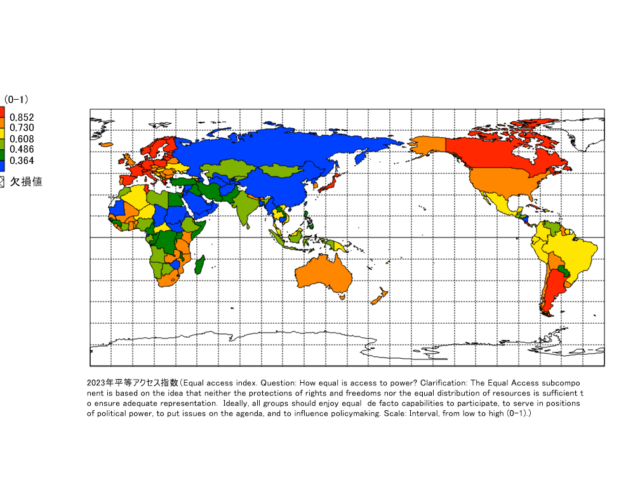
Title
Equal access index. Question: How equal is access to power? Clarification: The Equal Access subcomponent is based on the idea that neither the protections of rights and freedoms nor the equal distribution of resources is sufficient to ensure adequate representation. Ideally, all groups should enjoy equal de facto capabilities to participate, to serve in positions of political power, to put issues on the agenda, and to influence policymaking. Scale: Interval, from low to high (0-1).
Source
Varieties of Democracy Institute (https://www.v-dem.net/data/the-v-dem-dataset/)
Google Earth
-
2018年給付の充実度 -社会保護・労働全体
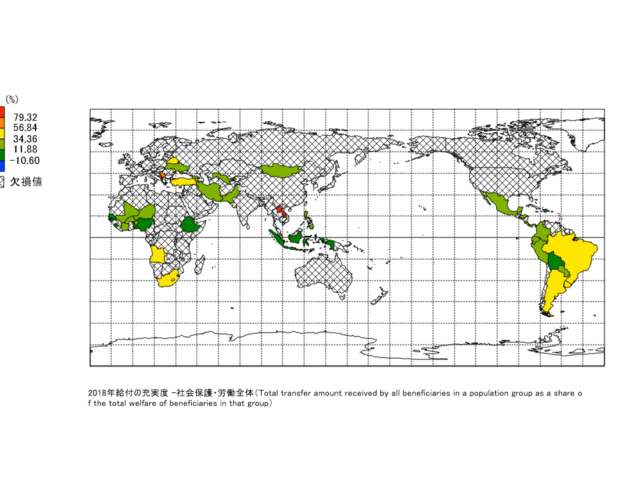
Title
Total transfer amount received by all beneficiaries in a population group as a share of the total welfare of beneficiaries in that group
Source
Data from database: ASPIRE – The Atlas of Social Protection: Indicators of Resilience and Equity
Google Earth
-
2023年資源の平等な配分(0から1の指数)
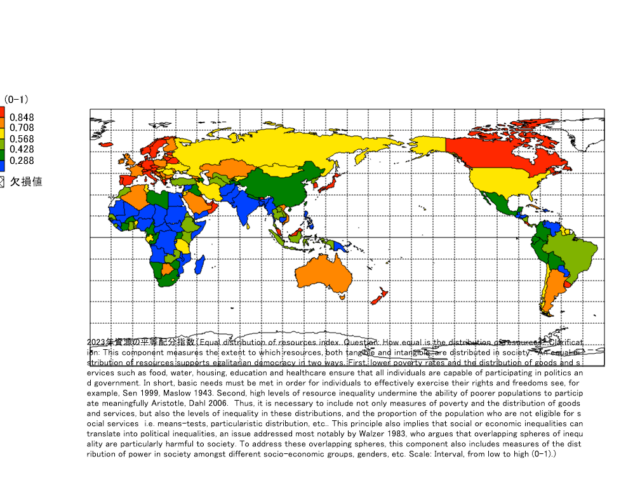
Title
Equal distribution of resources index. Question: How equal is the distribution of resources? Clarification: This component measures the extent to which resources, both tangible and intangible, are distributed in society. An equal distribution of resources supports egalitarian democracy in two ways. First, lower poverty rates and the distribution of goods and services such as food, water, housing, education and healthcare ensure that all individuals are capable of participating in politics and government. In short, basic needs must be met in order for individuals to effectively exercise their rights and freedoms see, for example, Sen 1999, Maslow 1943. Second, high levels of resource inequality undermine the ability of poorer populations to participate meaningfully Aristotle, Dahl 2006. Thus, it is necessary to include not only measures of poverty and the distribution of goods and services, but also the levels of inequality in these distributions, and the proportion of the population who are not eligible for social services i.e. means-tests, particularistic distribution, etc.. This principle also implies that social or economic inequalities can translate into political inequalities, an issue addressed most notably by Walzer 1983, who argues that overlapping spheres of inequality are particularly harmful to society. To address these overlapping spheres, this component also includes measures of the distribution of power in society amongst different socio-economic groups, genders, etc. Scale: Interval, from low to high (0-1).
Source
Varieties of Democracy Institute (https://www.v-dem.net/data/the-v-dem-dataset/)
Google Earth
-
2018年極貧層(購買力1日2.15ドル未満)への社会扶助給付の充実度
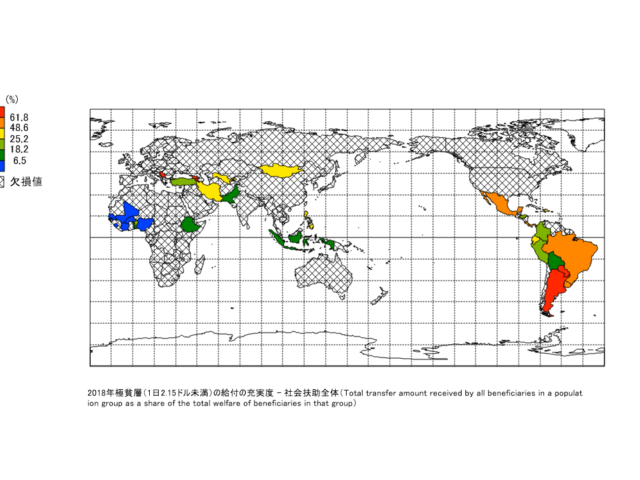
Title
(Total transfer amount received by all beneficiaries in a population group as a share of the total welfare of beneficiaries in that group)
Source
Data from database: ASPIRE – The Atlas of Social Protection: Indicators of Resilience and Equity
Google Earth
-
2018年極貧層(購買力1日2.15ドル未満)への社会保険給付の充実度
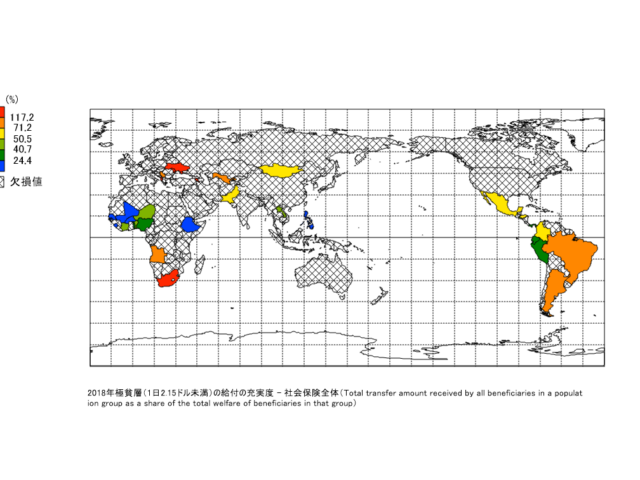
Title
(Total transfer amount received by all beneficiaries in a population group as a share of the total welfare of beneficiaries in that group)
Source
Data from database: ASPIRE – The Atlas of Social Protection: Indicators of Resilience and Equity
Google Earth
-
2018年給付の充実度 – 社会保険全体
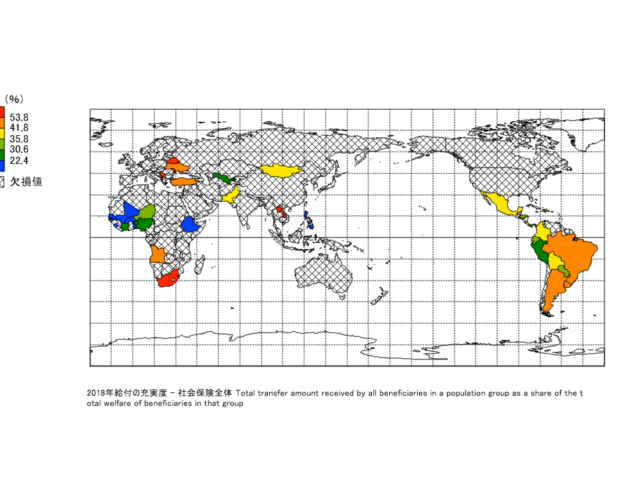
Title
Total transfer amount received by all beneficiaries in a population group as a share of the total welfare of beneficiaries in that group
Source
Data from database: ASPIRE – The Atlas of Social Protection: Indicators of Resilience and Equity
Google Earth
-
2022年初等教育修了者の失業率
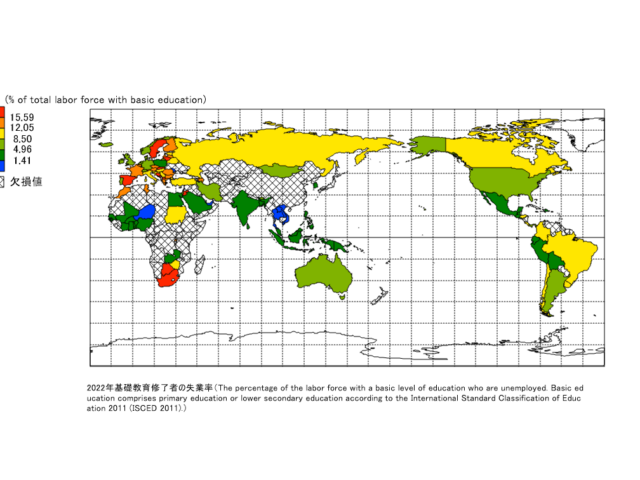
Title
The percentage of the labor force with a basic level of education who are unemployed. Basic education comprises primary education or lower secondary education according to the International Standard Classification of Education 2011 (ISCED 2011).
Source
International Labour Organization. “Education and Mismatch Indicators database (EMI)” ILOSTAT. Accessed September 06, 2024. https://ilostat.ilo.org/data/.
Google Earth
-
2022年中等教育修了者の失業率
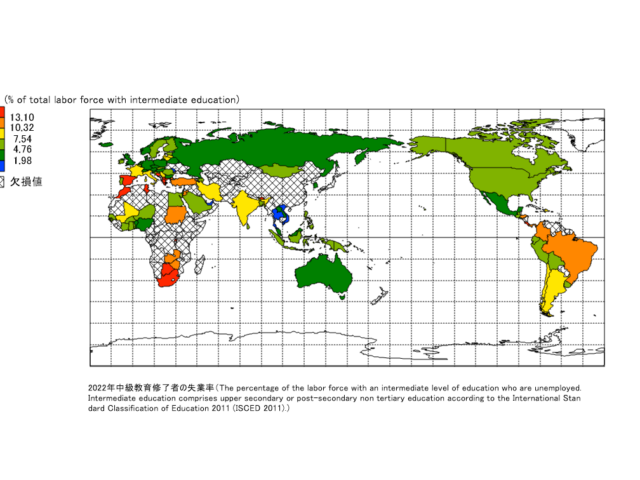
Title
The percentage of the labor force with an intermediate level of education who are unemployed. Intermediate education comprises upper secondary or post-secondary non tertiary education according to the International Standard Classification of Education 2011 (ISCED 2011).
Source
International Labour Organization. “Education and Mismatch Indicators database (EMI)” ILOSTAT. Accessed September 06, 2024. https://ilostat.ilo.org/data/.
Google Earth
-
2021年ジニ係数
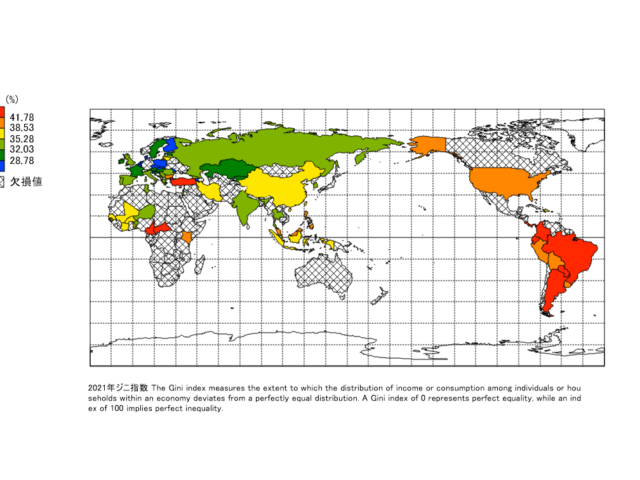
Title
The Gini index measures the extent to which the distribution of income or consumption among individuals or households within an economy deviates from a perfectly equal distribution. A Gini index of 0 represents perfect equality, while an index of 100 implies perfect inequality.
Source
World Bank, Poverty and Inequality Platform. Data are based on primary household survey data obtained from government statistical agencies and World Bank country departments. Data for high-income economies are mostly from the Luxembourg Income Study database. For more information and methodology, please see http://pip.worldbank.org.
Google Earth
-
2022年高等教育修了者の失業率
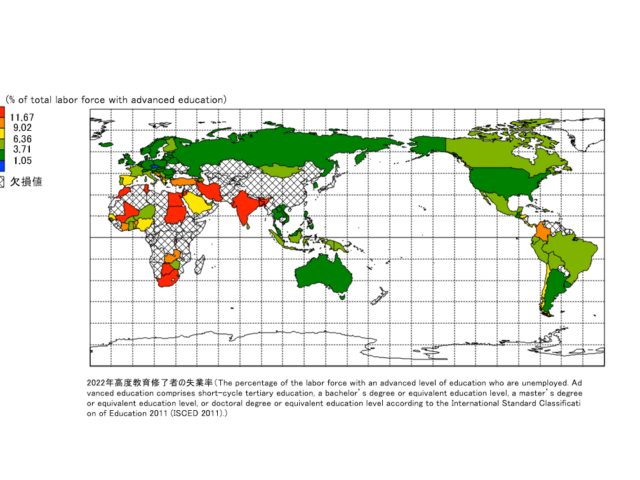
Title
The percentage of the labor force with an advanced level of education who are unemployed. Advanced education comprises short-cycle tertiary education, a bachelor’s degree or equivalent education level, a master’s degree or equivalent education level, or doctoral degree or equivalent education level according to the International Standard Classification of Education 2011 (ISCED 2011).
Source
International Labour Organization. “Education and Mismatch Indicators database (EMI)” ILOSTAT. Accessed September 06, 2024. https://ilostat.ilo.org/data/.
Google Earth
-
2023年多次元貧困指数(MPI)
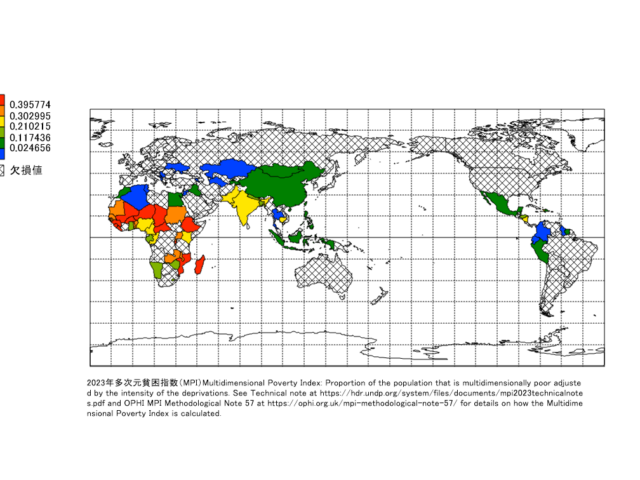
Title
Multidimensional Poverty Index: Proportion of the population that is multidimensionally poor adjusted by the intensity of the deprivations. See Technical note at https://hdr.undp.org/system/files/documents/mpi2023technicalnotes.pdf and OPHI MPI Methodological Note 57 at https://ophi.org.uk/mpi-methodological-note-57/ for details on how the Multidimensional Poverty Index is calculated.
Source
Data source: https://hdr.undp.org/content/2023-global-multidimensional-poverty-index-mpi#/indicies/MPI. Data and methodology are described in Alkire, S., Kanagaratnam, U., and Suppa, N. (2023c). A methodological note on the global Multidimensional Poverty Index (MPI) 2023 changes over time results for 84 countries. OPHI MPI Methodological Note 57, Oxford Poverty and Human Development Initiative. ©2018 University of Oxford.
Google Earth
-
2021年世界銀行が採用する社会的貧困ライン以下の貧困人口の割合
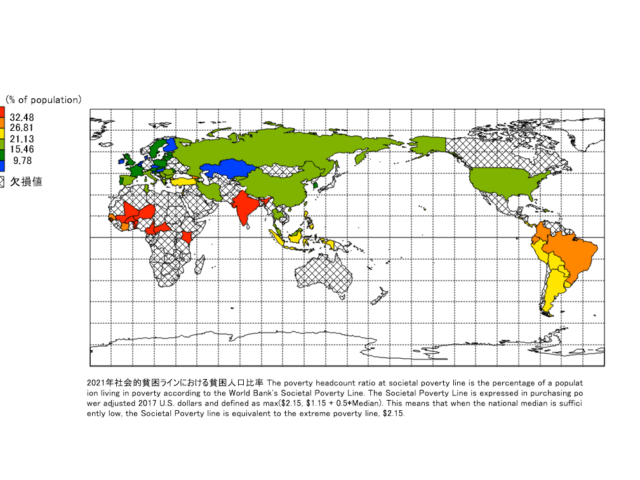
Title
The poverty headcount ratio at societal poverty line is the percentage of a population living in poverty according to the World Bank’s Societal Poverty Line. The Societal Poverty Line is expressed in purchasing power adjusted 2017 U.S. dollars and defined as max($2.15, $1.15 + 0.5*Median). This means that when the national median is sufficiently low, the Societal Poverty line is equivalent to the extreme poverty line, $2.15.
Source
World Bank, Poverty and Inequality Platform. Data are compiled from official government sources or are computed by World Bank staff using national (i.e. country–specific) poverty lines.
Google Earth
-
2023年国連開発計画(UNDP)が採用する多次元貧困人口の割合
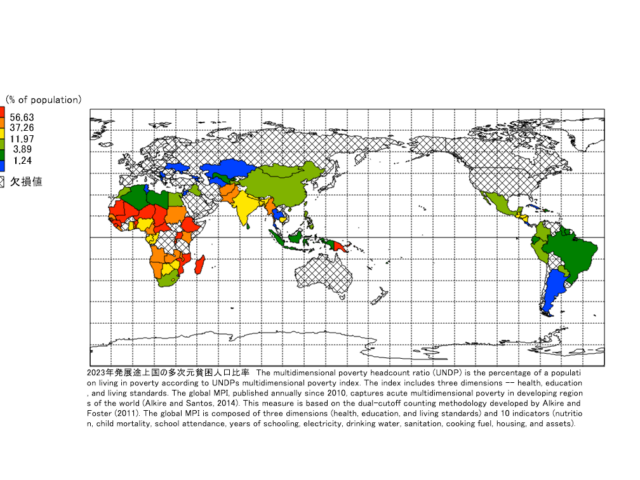
Title
The multidimensional poverty headcount ratio (UNDP) is the percentage of a population living in poverty according to UNDPs multidimensional poverty index. The index includes three dimensions — health, education, and living standards. The global MPI, published annually since 2010, captures acute multidimensional poverty in developing regions of the world (Alkire and Santos, 2014). This measure is based on the dual-cutoff counting methodology developed by Alkire and Foster (2011). The global MPI is composed of three dimensions (health, education, and living standards) and 10 indicators (nutrition, child mortality, school attendance, years of schooling, electricity, drinking water, sanitation, cooking fuel, housing, and assets).
Source
Data source: https://hdr.undp.org/content/2023-global-multidimensional-poverty-index-mpi#/indicies/MPI. Alkire, S., Kanagaratnam, U., and Suppa, N. (2023). ‘The global Multidimensional Poverty Index (MPI) 2023 country results and methodological note’, OPHI MPI Methodological Note 55, Oxford Poverty and Human Development Initiative (OPHI), University of Oxford. (https://ophi.org.uk/mpi-methodological-note-55-2/)
Google Earth
-
2021年購買力が1日6.85ドル以下の(2017年購買力平価)貧困人口の割合
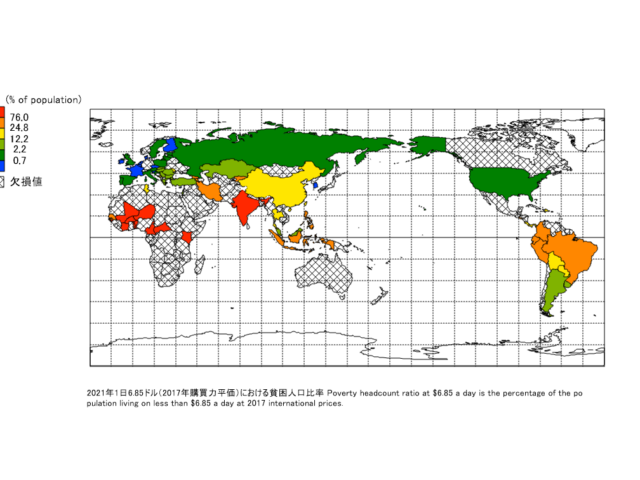
Title
Poverty headcount ratio at $6.85 a day is the percentage of the population living on less than $6.85 a day at 2017 international prices.
Source
World Bank, Poverty and Inequality Platform. Data are based on primary household survey data obtained from government statistical agencies and World Bank country departments. Data for high-income economies are mostly from the Luxembourg Income Study database. For more information and methodology, please see http://pip.worldbank.org.
Google Earth
-
2021年各国が定める貧困ライン以下の貧困人口の割合
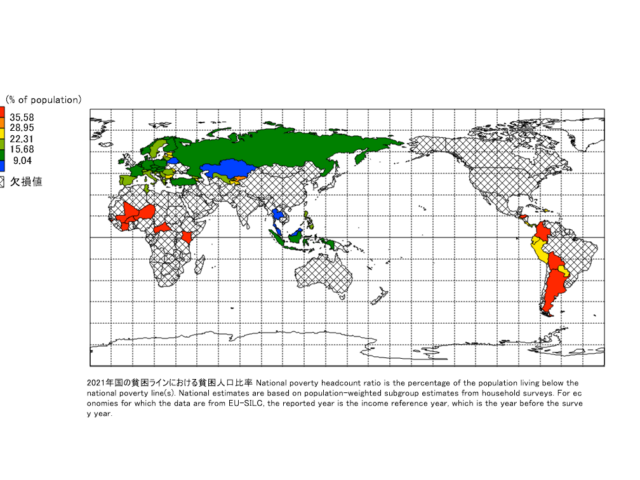
Title
National poverty headcount ratio is the percentage of the population living below the national poverty line(s). National estimates are based on population-weighted subgroup estimates from household surveys. For economies for which the data are from EU-SILC, the reported year is the income reference year, which is the year before the survey year.
Source
World Bank, Poverty and Inequality Platform. Data are compiled from official government sources or are computed by World Bank staff using national (i.e. country–specific) poverty lines.
Google Earth
-
2021年購買力が1日2.15ドル以下の(2017年購買力平価)貧困人口の割合
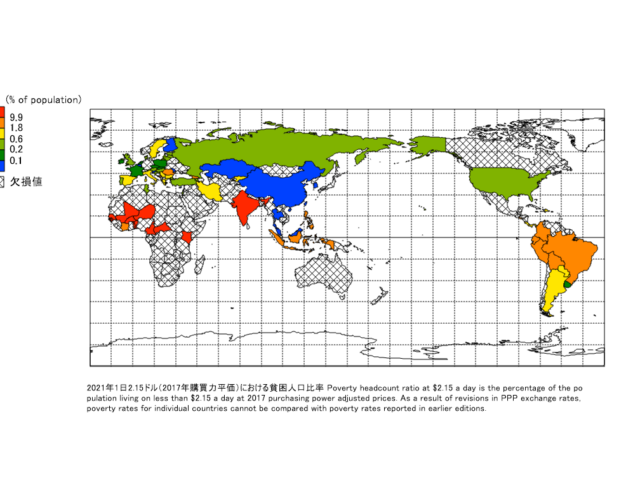
Title
Poverty headcount ratio at $2.15 a day is the percentage of the population living on less than $2.15 a day at 2017 purchasing power adjusted prices. As a result of revisions in PPP exchange rates, poverty rates for individual countries cannot be compared with poverty rates reported in earlier editions.
Source
World Bank, Poverty and Inequality Platform. Data are based on primary household survey data obtained from government statistical agencies and World Bank country departments. Data for high-income economies are mostly from the Luxembourg Income Study database. For more information and methodology, please see http://pip.worldbank.org.
Google Earth
-
2021年購買力が1日3.65ドル以下の(2017年購買力平価)貧困人口の割合
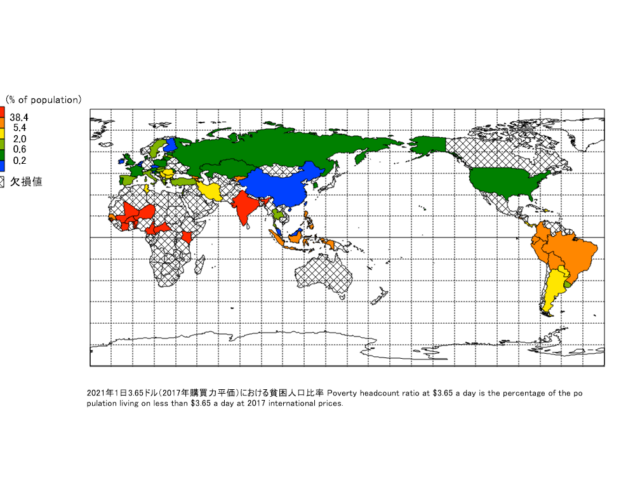
Title
Poverty headcount ratio at $3.65 a day is the percentage of the population living on less than $3.65 a day at 2017 international prices.
Source
World Bank, Poverty and Inequality Platform. Data are based on primary household survey data obtained from government statistical agencies and World Bank country departments. Data for high-income economies are mostly from the Luxembourg Income Study database. For more information and methodology, please see http://pip.worldbank.org.
Google Earth
-
2015年全雇用に占める脆弱な雇用の割合(脆弱な雇用とは家族労働や自営業を指す)
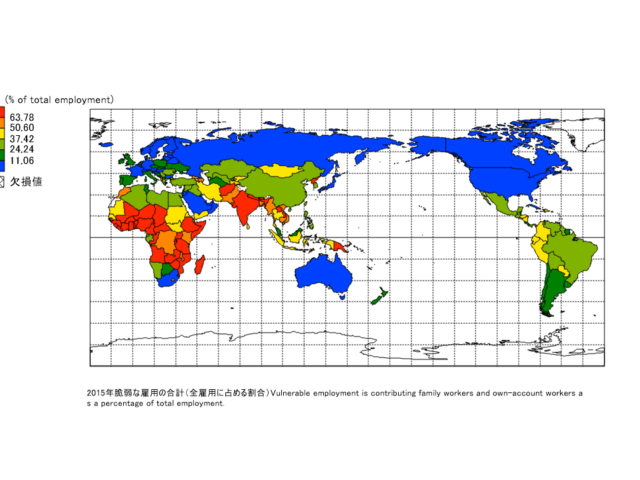
Title
Vulnerable employment is contributing family workers and own-account workers as a percentage of total employment.
Source
World Bank, World Development Indicators database. Estimates are based on data obtained from International Labour Organization, ILOSTAT at https://ilostat.ilo.org/data/.
Google Earth
-
2018年都市人口に占めるスラムの居住人口割合
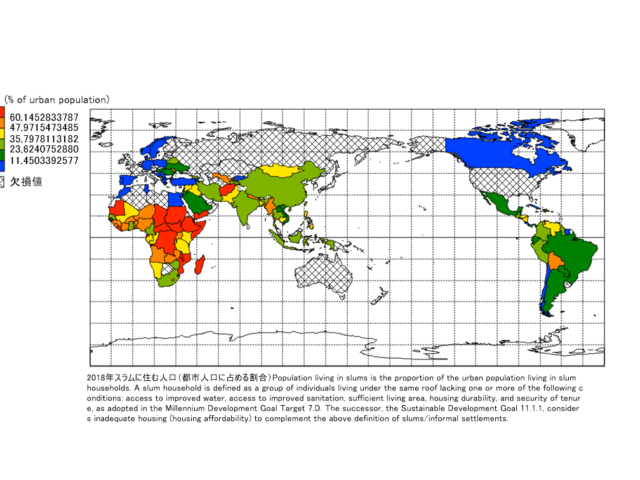
Title
Population living in slums is the proportion of the urban population living in slum households. A slum household is defined as a group of individuals living under the same roof lacking one or more of the following conditions: access to improved water, access to improved sanitation, sufficient living area, housing durability, and security of tenure, as adopted in the Millennium Development Goal Target 7.D. The successor, the Sustainable Development Goal 11.1.1, considers inadequate housing (housing affordability) to complement the above definition of slums/informal settlements.
Source
United Nations Human Settlements Programme (UN-HABITAT)
Google Earth
資源アクセス Resources
Mandara
-
2023年政治は顧客主義か(顧客主義とは、政策支持の見返りに財やサービスを期待する関係。0は民主主義的、1は顧客主義的)
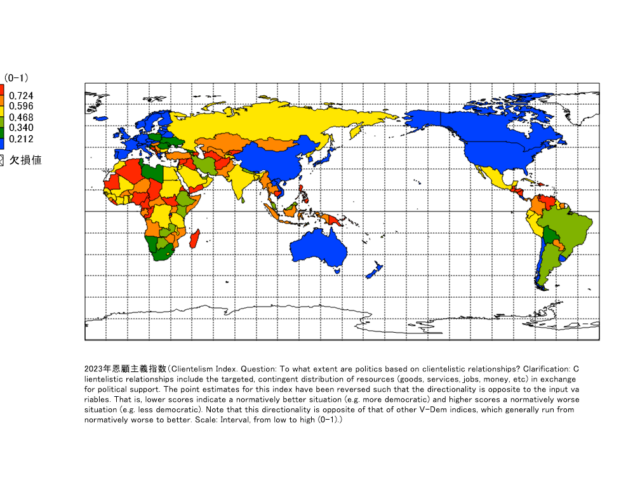
Title
Clientelism Index. Question: To what extent are politics based on clientelistic relationships? Clarification: Clientelistic relationships include the targeted, contingent distribution of resources (goods, services, jobs, money, etc) in exchange for political support. The point estimates for this index have been reversed such that the directionality is opposite to the input variables. That is, lower scores indicate a normatively better situation (e.g. more democratic) and higher scores a normatively worse situation (e.g. less democratic). Note that this directionality is opposite of that of other V-Dem indices, which generally run from normatively worse to better. Scale: Interval, from low to high (0-1).
Source
Varieties of Democracy Institute (https://www.v-dem.net/data/the-v-dem-dataset/)
Google Earth
-
社会保障事業の対象人口比
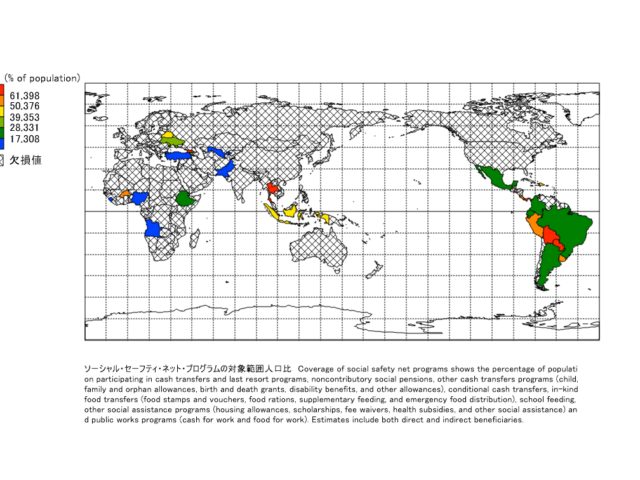
Title
Coverage of social safety net programs shows the percentage of population participating in cash transfers and last resort programs, noncontributory social pensions, other cash transfers programs (child, family and orphan allowances, birth and death grants, disability benefits, and other allowances), conditional cash transfers, in-kind food transfers (food stamps and vouchers, food rations, supplementary feeding, and emergency food distribution), school feeding, other social assistance programs (housing allowances, scholarships, fee waivers, health subsidies, and other social assistance) and public works programs (cash for work and food for work). Estimates include both direct and indirect beneficiaries.
Source
Data from database: Sustainable Development Goals (SDGs). ASPIRE: The Atlas of Social Protection – Indicators of Resilience and Equity, The World Bank. Data are based on national representative household surveys. (datatopics.worldbank.org/aspire/)
Google Earth
-
2023年司法に確実かつ効率的にアクセスできるか
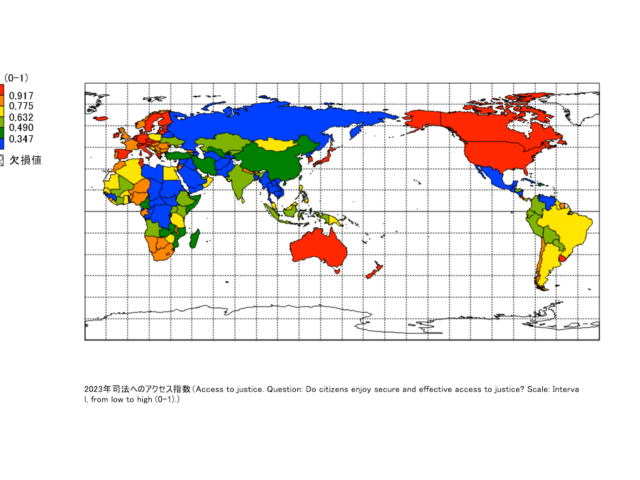
Title
Access to justice. Question: Do citizens enjoy secure and effective access to justice? Scale: Interval, from low to high (0-1).)
Source
Varieties of Democracy Institute (https://www.v-dem.net/data/the-v-dem-dataset/)
Google Earth
-
2018年社会保険加入率
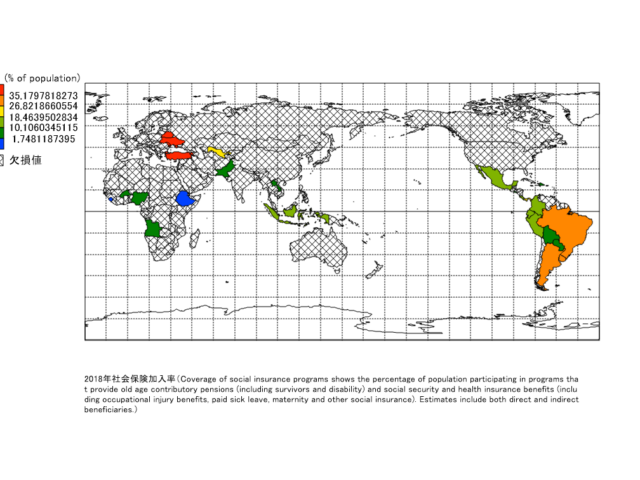
Title
Coverage of social insurance programs shows the percentage of population participating in programs that provide old age contributory pensions (including survivors and disability) and social security and health insurance benefits (including occupational injury benefits, paid sick leave, maternity and other social insurance). Estimates include both direct and indirect beneficiaries.
Source
Data from database: Sustainable Development Goals (SDGs). ASPIRE: The Atlas of Social Protection – Indicators of Resilience and Equity, The World Bank. Data are based on national representative household surveys. (datatopics.worldbank.org/aspire/)
Google Earth
-
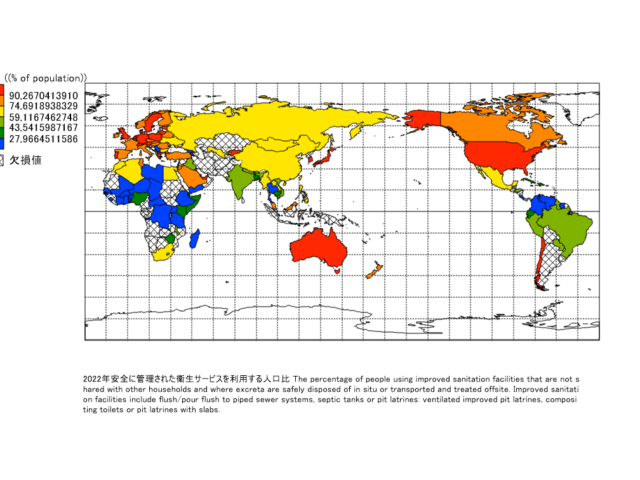
2022年安全に管理された衛生サービスを利用する人口比
Title
The percentage of people using improved sanitation facilities that are not shared with other households and where excreta are safely disposed of in situ or transported and treated offsite. Improved sanitation facilities include flush/pour flush to piped sewer systems, septic tanks or pit latrines: ventilated improved pit latrines, compositing toilets or pit latrines with slabs.
Source
Data from database: World Development Indicators. WHO/UNICEF Joint Monitoring Programme (JMP) for Water Supply, Sanitation and Hygiene (washdata.org). Data on drinking water, sanitation and hygiene are produced by the Joint Monitoring Programme of the World Health Organization (WHO) and United Nations Children’s Fund (UNICEF) based on administrative sources, national censuses and nationally representative household surveys. WHO/UNICEF defines safely managed sanitation facilities as improved sanitation facilities that are not shared with other households and where excreta are safely disposed of in situ or transported and treated offsite. Improved sanitation facilities include flush/pour flush to piped sewer systems, septic tanks or pit latrines: ventilated improved pit latrines, compositing toilets or pit latrines with slabs. There are three main ways to meet the criteria for having a safely managed sanitation service (People should use improved sanitation facilities that are not shared with other households, and the excreta produced should either be: treated and disposed of in situ; stored temporality and then emptied, transported and treated off-site, or transported through a sewer with wastewater and then treated off-site). Many countries lack information on either wastewater treatment or the management of on-site sanitation. A national estimate is produced if information is available for the dominant type of sanitation system. If no information is available, it is assumed that 50 percent is safely managed. Regional and income group estimates are made when data are available for at least 30 percent of the population.
Google Earth
-
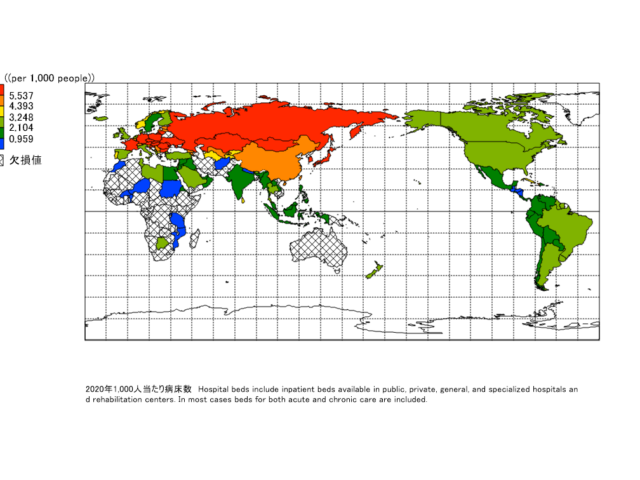
2020年1,000人当たり病床数
Title
Hospital beds include inpatient beds available in public, private, general, and specialized hospitals and rehabilitation centers. In most cases beds for both acute and chronic care are included.
Source
Data from database: World Development Indicators. World Health Organization, supplemented by country data. Depending on the source and means of monitoring, data may not be exactly comparable across countries. For more information, see the original source.
Google Earth
-
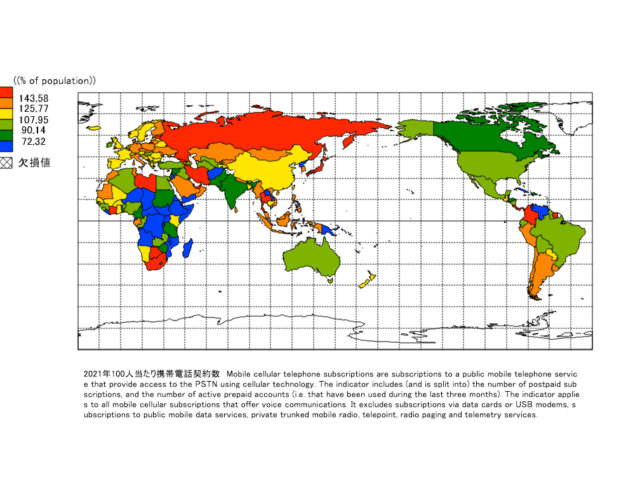
2021年100人当たり携帯電話契約数
Title
Mobile cellular telephone subscriptions are subscriptions to a public mobile telephone service that provide access to the PSTN using cellular technology. The indicator includes (and is split into) the number of postpaid subscriptions, and the number of active prepaid accounts (i.e. that have been used during the last three months). The indicator applies to all mobile cellular subscriptions that offer voice communications. It excludes subscriptions via data cards or USB modems, subscriptions to public mobile data services, private trunked mobile radio, telepoint, radio paging and telemetry services.
Source
Data from database: World Development Indicators. International Telecommunication Union (ITU) World Telecommunication/ICT Indicators Database. Refers to the subscriptions to a public mobile telephone service and provides access to Public Switched Telephone Network (PSTN) using cellular technology, including number of pre-paid SIM cards active during the past three months. This includes both analogue and digital cellular systems (IMT-2000 (Third Generation, 3G) and 4G subscriptions, but excludes mobile broadband subscriptions via data cards or USB modems. Subscriptions to public mobile data services, private trunked mobile radio, telepoint or radio paging, and telemetry services should also be excluded. This should include all mobile cellular subscriptions that offer voice communications. Data on mobile cellular subscribers are derived using administrative data that countries (usually the regulatory telecommunication authority or the Ministry in charge of telecommunications) regularly, and at least annually, collect from telecommunications operators. Data for this indicator are readily available for approximately 90 percent of countries, either through ITU’s World Telecommunication Indicators questionnaires or from official information available on the Ministry or Regulator’s website. For the rest, information can be aggregated through operators’ data (mainly through annual reports) and complemented by market research reports. Mobile cellular subscriptions (per 100 people) indicator is derived by all mobile subscriptions divided by the country’s population and multiplied by 100. For additional/latest information on sources and country notes, please also refer to: https://www.itu.int/en/ITU-D/Statistics/Pages/stat/default.aspx.
Google Earth
-
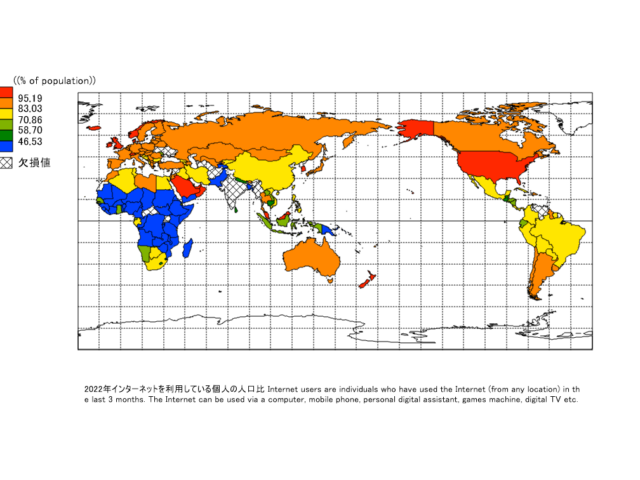
2022年インターネットを利用している個人の人口比
Title
Internet users are individuals who have used the Internet (from any location) in the last 3 months. The Internet can be used via a computer, mobile phone, personal digital assistant, games machine, digital TV etc.
Source
Data from database: World Development Indicators. International Telecommunication Union (ITU) World Telecommunication/ICT Indicators Database. The Internet is a world-wide public computer network. It provides access to a number of communication services including the World Wide Web and carries email, news, entertainment and data files, irrespective of the device used (not assumed to be only via a computer – it may also be by mobile phone, PDA, games machine, digital TV etc.). Access can be via a fixed or mobile network. For additional/latest information on sources and country notes, please also refer to: https://www.itu.int/en/ITU-D/Statistics/Pages/stat/default.aspx.
Google Earth
-
2023年100人当たり固定電話契約数
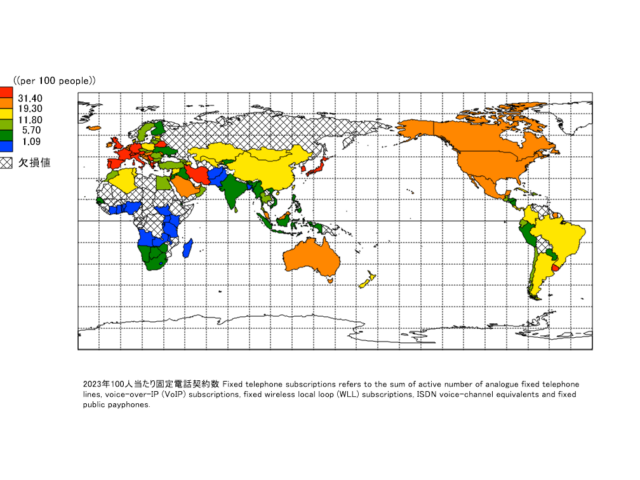
Title
Fixed telephone subscriptions refers to the sum of active number of analogue fixed telephone lines, voice-over-IP (VoIP) subscriptions, fixed wireless local loop (WLL) subscriptions, ISDN voice-channel equivalents and fixed public payphones.
Source
Data from database: World Development Indicators. International Telecommunication Union (ITU) World Telecommunication/ICT Indicators Database. A fixed telephone line (previously called main telephone line in operation) is an active line connecting the subscriber’s terminal equipment to the public switched telephone network (PSTN) and which has a dedicated port in the telephone exchange equipment. For additional/latest information on sources and country notes, please also refer to: https://www.itu.int/en/ITU-D/Statistics/Pages/stat/default.aspx.
Google Earth
-
2022年初等・中等教育における不就学児童数
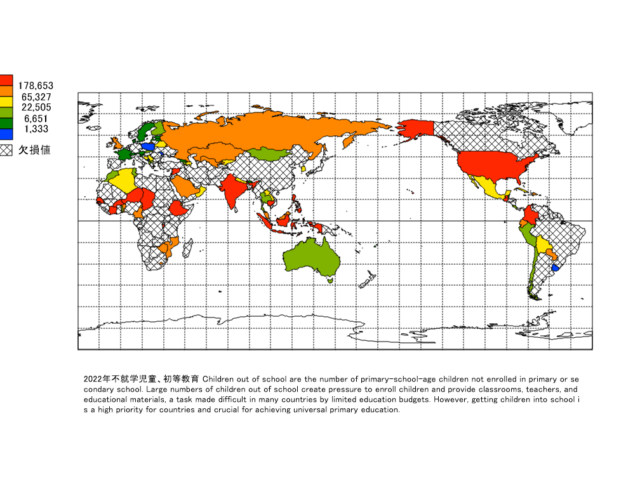
Title
Children out of school are the number of primary-school-age children not enrolled in primary or secondary school. Large numbers of children out of school create pressure to enroll children and provide classrooms, teachers, and educational materials, a task made difficult in many countries by limited education budgets. However, getting children into school is a high priority for countries and crucial for achieving universal primary education.
Source
Data from database: World Development Indicators. UNESCO Institute for Statistics (UIS). UIS.Stat Bulk Data Download Service. Accessed April 24, 2024. https://apiportal.uis.unesco.org/bdds. The number of out-of-school children is calculated by subtracting the number of primary school-age children enrolled in primary or secondary school from the total population of the official primary school-age children. Due to different data sources for enrollment and population data, the number may not capture the actual number of children not attending in primary school.
Google Earth
-
2023年100人当たり固定ブロードバンド契約数
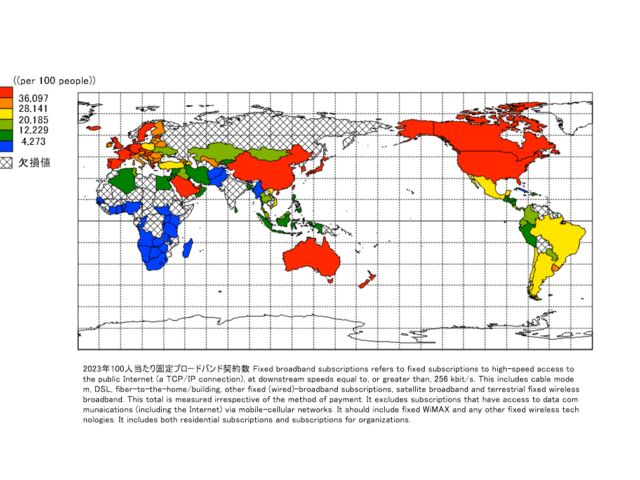
Title
Fixed broadband subscriptions refers to fixed subscriptions to high-speed access to the public Internet (a TCP/IP connection), at downstream speeds equal to, or greater than, 256 kbit/s. This includes cable modem, DSL, fiber-to-the-home/building, other fixed (wired)-broadband subscriptions, satellite broadband and terrestrial fixed wireless broadband. This total is measured irrespective of the method of payment. It excludes subscriptions that have access to data communaications (including the Internet) via mobile-cellular networks. It should include fixed WiMAX and any other fixed wireless technologies. It includes both residential subscriptions and subscriptions for organizations.
Source
Data from database: World Development Indicators. International Telecommunication Union (ITU) World Telecommunication/ICT Indicators Database. Data refer to subscriptions to high-speed access to the public Internet (a TCP/IP connection), at downstream speeds equal to, or greater than, 256 kbit/s. For additional/latest information on sources and country notes, please also refer to: https://www.itu.int/en/ITU-D/Statistics/Pages/stat/default.aspx.
Google Earth
-
1人当たり耕地面積
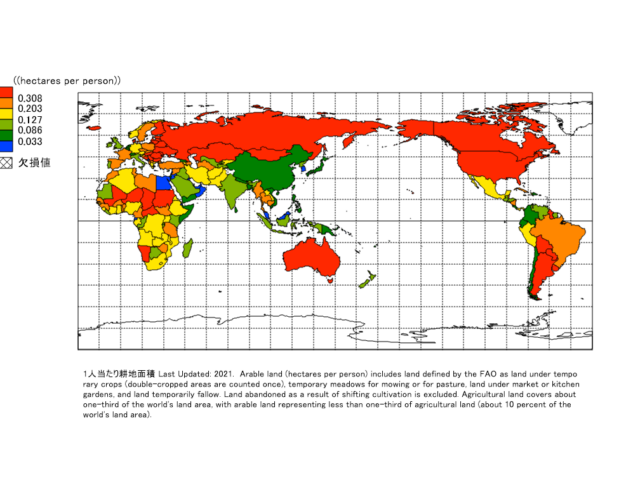
Title
Last Updated: 2021. Arable land (hectares per person) includes land defined by the FAO as land under temporary crops (double-cropped areas are counted once), temporary meadows for mowing or for pasture, land under market or kitchen gardens, and land temporarily fallow. Land abandoned as a result of shifting cultivation is excluded. Agricultural land covers about one-third of the world’s land area, with arable land representing less than one-third of agricultural land (about 10 percent of the world’s land area).
Source
Data from database: World Development Indicators. Food and Agriculture Organization, electronic files and web site. Temporary fallow land refers to land left fallow for less than five years. The abandoned land resulting from shifting cultivation is not included in this category. Data for “Arable land” are not meant to indicate the amount of land that is potentially cultivable. The data collected by the Food and Agriculture Organization (FAO) of the United Nations from official national sources through the questionnaire are supplemented with information from official secondary data sources. The secondary sources cover official country data from websites of national ministries, national publications and related country data reported by various international organizations.
Google Earth
-
農地(平方キロメートル)
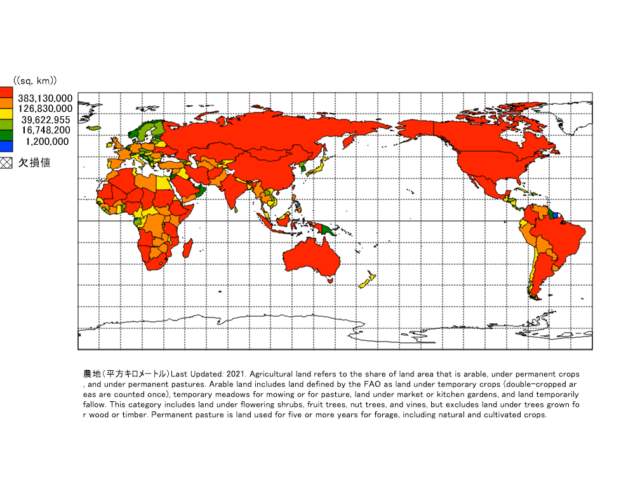
Title
Last Updated: 2021. Agricultural land refers to the share of land area that is arable, under permanent crops, and under permanent pastures. Arable land includes land defined by the FAO as land under temporary crops (double-cropped areas are counted once), temporary meadows for mowing or for pasture, land under market or kitchen gardens, and land temporarily fallow. This category includes land under flowering shrubs, fruit trees, nut trees, and vines, but excludes land under trees grown for wood or timber. Permanent pasture is land used for five or more years for forage, including natural and cultivated crops.
Source
Data from database: World Development Indicators. Food and Agriculture Organization, electronic files and web site.
Google Earth
-
農地(土地面積に占める割合)
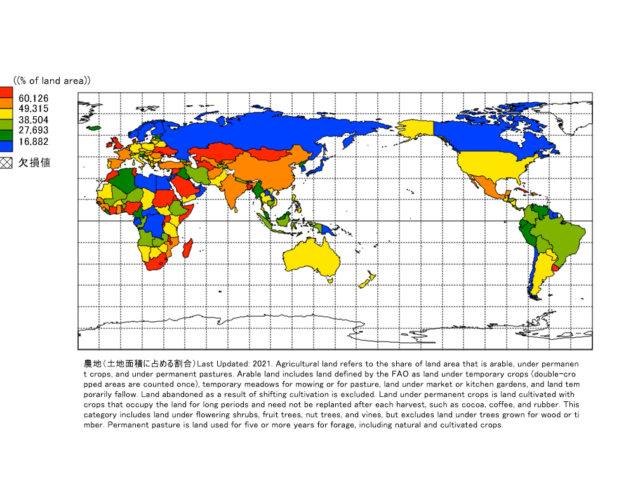
Title
Last Updated: 2021. Agricultural land refers to the share of land area that is arable, under permanent crops, and under permanent pastures. Arable land includes land defined by the FAO as land under temporary crops (double-cropped areas are counted once), temporary meadows for mowing or for pasture, land under market or kitchen gardens, and land temporarily fallow. Land abandoned as a result of shifting cultivation is excluded. Land under permanent crops is land cultivated with crops that occupy the land for long periods and need not be replanted after each harvest, such as cocoa, coffee, and rubber. This category includes land under flowering shrubs, fruit trees, nut trees, and vines, but excludes land under trees grown for wood or timber. Permanent pasture is land used for five or more years for forage, including natural and cultivated crops.
Source
Data from database: World Development Indicators. Food and Agriculture Organization, electronic files and web site.
Google Earth
-
2022年電気へのアクセス
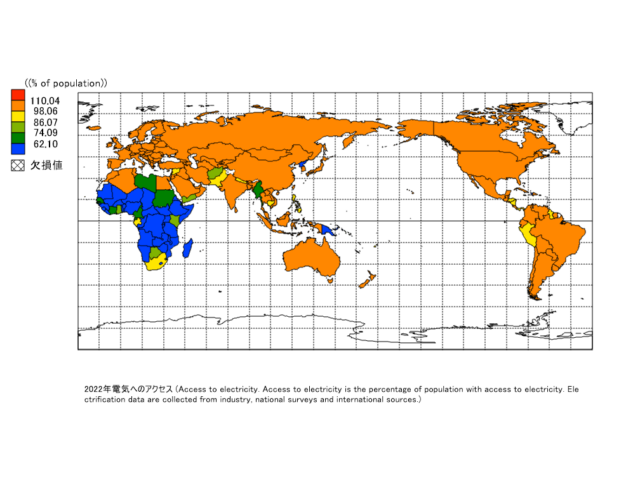
Title
Access to electricity. Access to electricity is the percentage of population with access to electricity. Electrification data are collected from industry, national surveys and international sources.
Source
Data from database: World Development Indicators. IEA, IRENA, UNSD, World Bank, WHO. 2023. Tracking SDG 7: The Energy Progress Report. World Bank, Washington DC. © World Bank. License: Creative Commons Attribution—NonCommercial 3.0 IGO (CC BY-NC 3.0 IGO).
Google Earth
-
2022年調理用クリーン燃料と技術へのアクセス
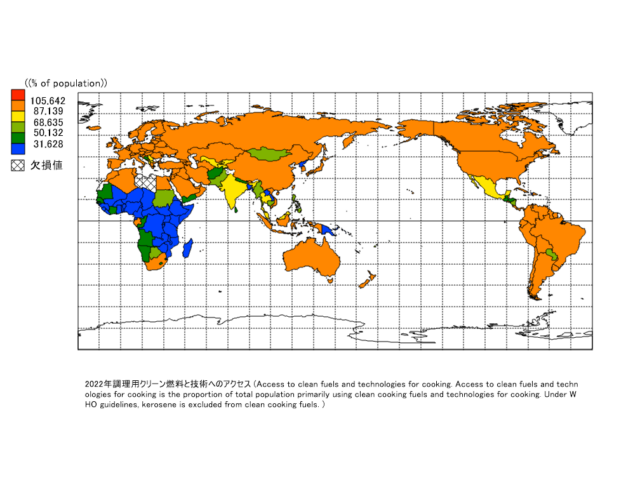
Title
Access to clean fuels and technologies for cooking. Access to clean fuels and technologies for cooking is the proportion of total population primarily using clean cooking fuels and technologies for cooking. Under WHO guidelines, kerosene is excluded from clean cooking fuels.
Source
Data from database: World Development Indicators. IEA, IRENA, UNSD, World Bank, WHO. 2023. Tracking SDG 7: The Energy Progress Report. World Bank, Washington DC. © World Bank. License: Creative Commons Attribution—NonCommercial 3.0 IGO (CC BY-NC 3.0 IGO). Data for access to clean fuels and technologies for cooking are based on the World Health Organization’s (WHO) Global Household Energy Database. They are collected among different sources: only data from nationally representative household surveys (including national censuses) were used. Survey sources include Demographic and Health Surveys (DHS) and Living Standards Measurement Surveys (LSMS), Multi-Indicator Cluster Surveys (MICS), the World Health Survey (WHS), other nationally developed and implemented surveys, and various government agencies (for example, ministries of energy and utilities). Trends in the proportion of the population using each fuel type are estimated using a single multivariate hierarchical model, with urban and rural disaggregation. Estimates for overall ‘polluting’ fuels (unprocessed biomass, charcoal, coal, and kerosene) and ‘clean’ fuels (gaseous fuels, electricity, as well as an aggregation of any other clean fuels like alcohol) are produced by aggregating estimates of relevant fuel types. The model was used to derive clean fuel use estimates for 191 countries (ref. Stoner, O., Shaddick, G., Economou, T., Gumy, S., Lewis, J., Lucio, I., Ruggeri, G. and Adair-Rohani, H. (2020), Global household energy model: a multivariate hierarchical approach to estimating trends in the use of polluting and clean fuels for cooking. J. R. Stat. Soc. C, 69: 815-839). Countries classified by the World Bank as high income (57 countries) in the 2022 fiscal year are assumed to have universal access to clean fuels and technologies for cooking.
Google Earth
-
2023年統合的な水資源管理の実施度
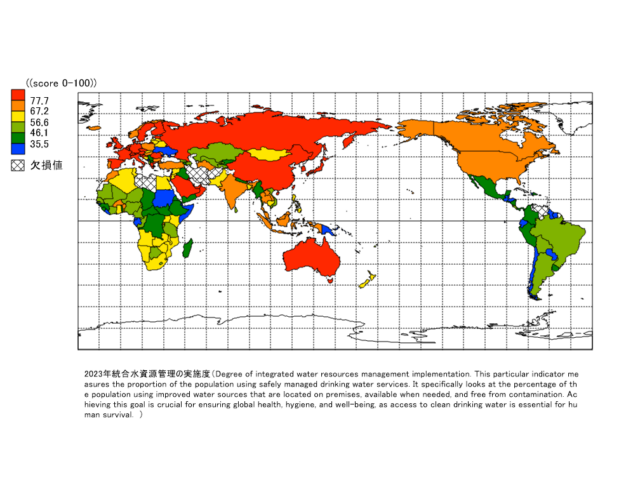
Title
Degree of integrated water resources management implementation. This particular indicator measures the proportion of the population using safely managed drinking water services. It specifically looks at the percentage of the population using improved water sources that are located on premises, available when needed, and free from contamination. Achieving this goal is crucial for ensuring global health, hygiene, and well-being, as access to clean drinking water is essential for human survival.
Source
Data from database: IWRM Data (http://iwrmdataportal.unepdhi.org/)
Google Earth
-
5歳までの生存確率
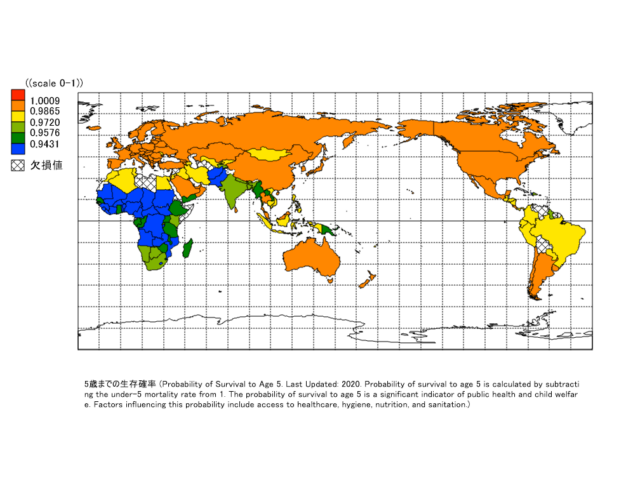
Title
Probability of Survival to Age 5. Last Updated: 2020. Probability of survival to age 5 is calculated by subtracting the under-5 mortality rate from 1. The probability of survival to age 5 is a significant indicator of public health and child welfare. Factors influencing this probability include access to healthcare, hygiene, nutrition, and sanitation.
Source
United Nations Inter-agency Group for Child Mortality Estimation (UN IGME), supplemented with data provided by World Bank staff.
Google Earth
-
15~60歳生存率
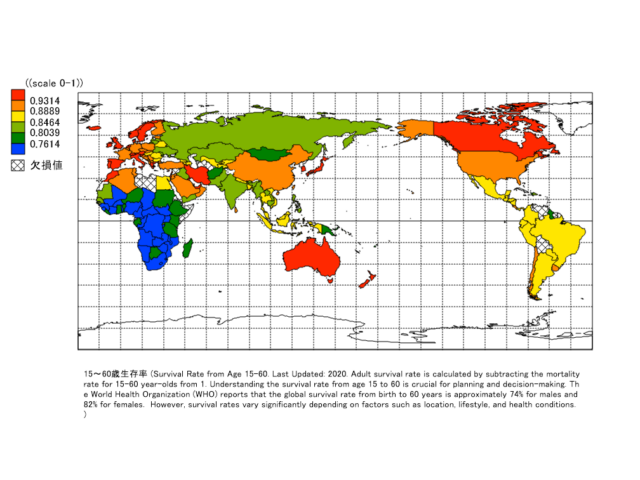
Title
Survival Rate from Age 15-60. Last Updated: 2020. Adult survival rate is calculated by subtracting the mortality rate for 15-60 year-olds from 1. Understanding the survival rate from age 15 to 60 is crucial for planning and decision-making. The World Health Organization (WHO) reports that the global survival rate from birth to 60 years is approximately 74% for males and 82% for females. However, survival rates vary significantly depending on factors such as location, lifestyle, and health conditions.
Source
United Nations Population Division, World Population Prospects: 2019 Revision, supplemented with data provided by World Bank Staff.
Google Earth
-
2020年人的資本指数
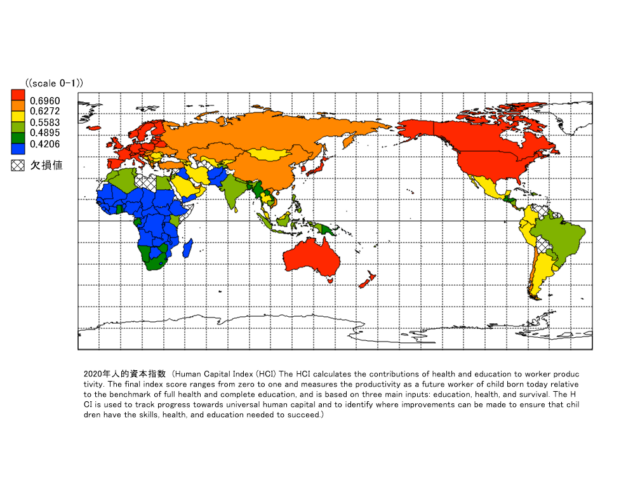
Title
Human Capital Index (HCI) The HCI calculates the contributions of health and education to worker productivity. The final index score ranges from zero to one and measures the productivity as a future worker of child born today relative to the benchmark of full health and complete education, and is based on three main inputs: education, health, and survival. The HCI is used to track progress towards universal human capital and to identify where improvements can be made to ensure that children have the skills, health, and education needed to succeed.
Source
World Bank staff calculations based on the methodology described in World Bank (2018). https://openknowledge.worldbank.org/handle/10986/30498.
Google Earth
-
2020年学習到達度
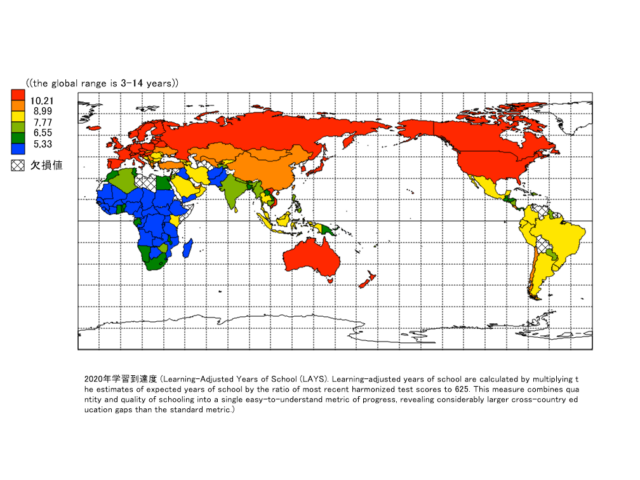
Title
Learning-Adjusted Years of School (LAYS). Learning-adjusted years of school are calculated by multiplying the estimates of expected years of school by the ratio of most recent harmonized test scores to 625. This measure combines quantity and quality of schooling into a single easy-to-understand metric of progress, revealing considerably larger cross-country education gaps than the standard metric.
Source
World Bank staff calculation based on methodology in Filmer et al. (2018). http://documents.worldbank.org/curated/en/243261538075151093/Learning-Adjusted-Years-of-Schooling-LAYS-Defining-A-New-Macro-Measure-of-Education
Google Earth
-
2020年統一テストスコア(主要な国際学校)
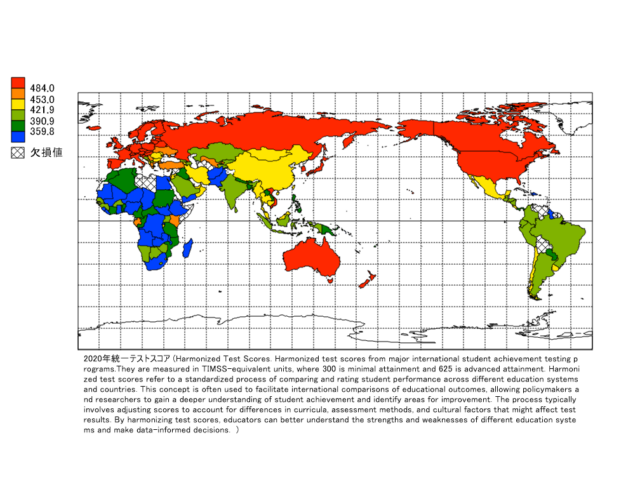
Title
Harmonized Test Scores. Harmonized test scores from major international student achievement testing programs.They are measured in TIMSS-equivalent units, where 300 is minimal attainment and 625 is advanced attainment. Harmonized test scores refer to a standardized process of comparing and rating student performance across different education systems and countries. This concept is often used to facilitate international comparisons of educational outcomes, allowing policymakers and researchers to gain a deeper understanding of student achievement and identify areas for improvement. The process typically involves adjusting scores to account for differences in curricula, assessment methods, and cultural factors that might affect test results. By harmonizing test scores, educators can better understand the strengths and weaknesses of different education systems and make data-informed decisions.
Source
Patrinos and Angrist (2018). http://documents.worldbank.org/curated/en/390321538076747773/Global-Dataset-on-Education-Quality-A-Review-and-Update-2000-2017
Google Earth
-
2020年在学予定年数
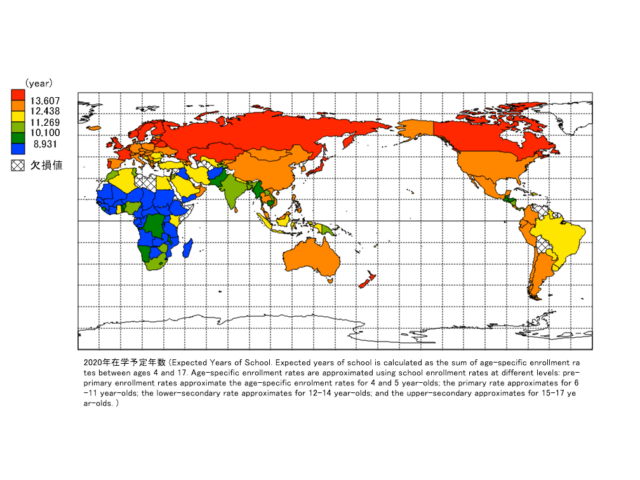
Title
Expected Years of School. Expected years of school is calculated as the sum of age-specific enrollment rates between ages 4 and 17. Age-specific enrollment rates are approximated using school enrollment rates at different levels: pre-primary enrollment rates approximate the age-specific enrolment rates for 4 and 5 year-olds; the primary rate approximates for 6-11 year-olds; the lower-secondary rate approximates for 12-14 year-olds; and the upper-secondary approximates for 15-17 year-olds.
Source
Data from database: Human Capital Index (https://databank.worldbank.org). World Bank staff estimates based on data from UNESCO Institute for Statistics, supplemented with data provided by World Bank staff.
Google Earth
-
2020年発育阻害でない5歳未満児の割合
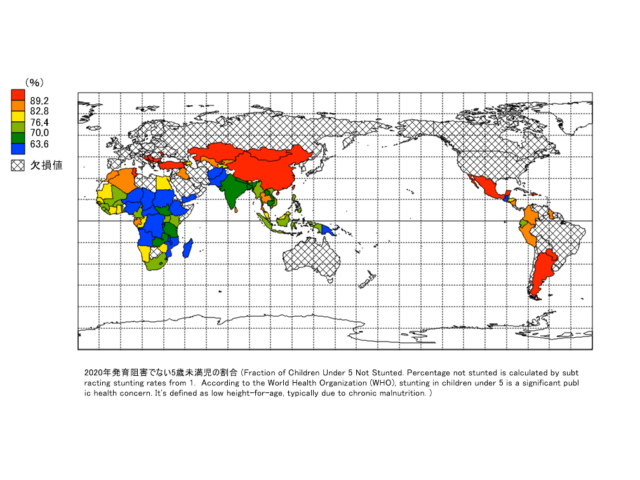
Title
Fraction of Children Under 5 Not Stunted. Percentage not stunted is calculated by subtracting stunting rates from 1. According to the World Health Organization (WHO), stunting in children under 5 is a significant public health concern. It’s defined as low height-for-age, typically due to chronic malnutrition.
Source
Data from database: Human Capital Index (https://databank.worldbank.org). UNICEF-WHO-World Bank Joint Malnutrition Estimates, supplemented with data provided by World Bank staff.
Google Earth
社会参加 Participation
Mandara
-
2023年都市-農村間の距離による公共サービスや空間からの排除(0から1の指数,0は排除がない,1は排除がある)
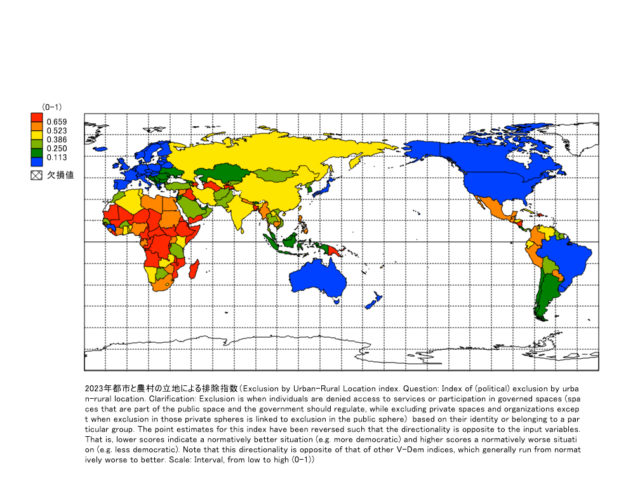
Title
Exclusion by Urban-Rural Location index. Question: Index of (political) exclusion by urban-rural location. Clarification: Exclusion is when individuals are denied access to services or participation in governed spaces (spaces that are part of the public space and the government should regulate, while excluding private spaces and organizations except when exclusion in those private spheres is linked to exclusion in the public sphere) based on their identity or belonging to a particular group. The point estimates for this index have been reversed such that the directionality is opposite to the input variables. That is, lower scores indicate a normatively better situation (e.g. more democratic) and higher scores a normatively worse situation (e.g. less democratic). Note that this directionality is opposite of that of other V-Dem indices, which generally run from normatively worse to better. Scale: Interval, from low to high (0-1)
Source
Varieties of Democracy Institute (https://www.v-dem.net/data/the-v-dem-dataset/)
Google Earth
-
2023年社会経済集団への所属による公共サービスや空間からの排除(0から1の指数)
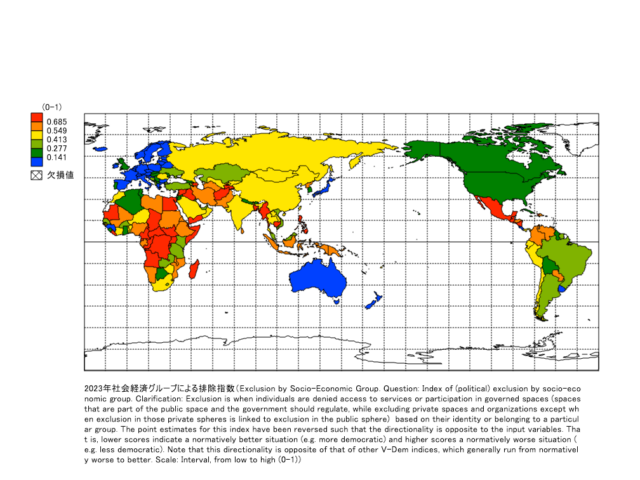
Title
Exclusion by Socio-Economic Group. Question: Index of (political) exclusion by socio-economic group. Clarification: Exclusion is when individuals are denied access to services or participation in governed spaces (spaces that are part of the public space and the government should regulate, while excluding private spaces and organizations except when exclusion in those private spheres is linked to exclusion in the public sphere) based on their identity or belonging to a particular group. The point estimates for this index have been reversed such that the directionality is opposite to the input variables. That is, lower scores indicate a normatively better situation (e.g. more democratic) and higher scores a normatively worse situation (e.g. less democratic). Note that this directionality is opposite of that of other V-Dem indices, which generally run from normatively worse to better. Scale: Interval, from low to high (0-1)
Source
Varieties of Democracy Institute (https://www.v-dem.net/data/the-v-dem-dataset/)
Google Earth
-
2023年政治属性による公共サービスや空間からの排除(0から1の指数)
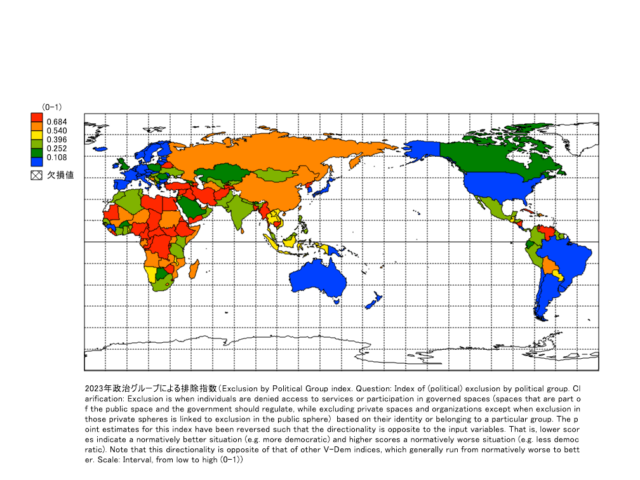
Title
Exclusion by Political Group index. Question: Index of (political) exclusion by political group. Clarification: Exclusion is when individuals are denied access to services or participation in governed spaces (spaces that are part of the public space and the government should regulate, while excluding private spaces and organizations except when exclusion in those private spheres is linked to exclusion in the public sphere) based on their identity or belonging to a particular group. The point estimates for this index have been reversed such that the directionality is opposite to the input variables. That is, lower scores indicate a normatively better situation (e.g. more democratic) and higher scores a normatively worse situation (e.g. less democratic). Note that this directionality is opposite of that of other V-Dem indices, which generally run from normatively worse to better. Scale: Interval, from low to high (0-1)
Source
Varieties of Democracy Institute (https://www.v-dem.net/data/the-v-dem-dataset/)
Google Earth
-
2023年社会属性による公共サービスや空間からの排除(0から1の指数)
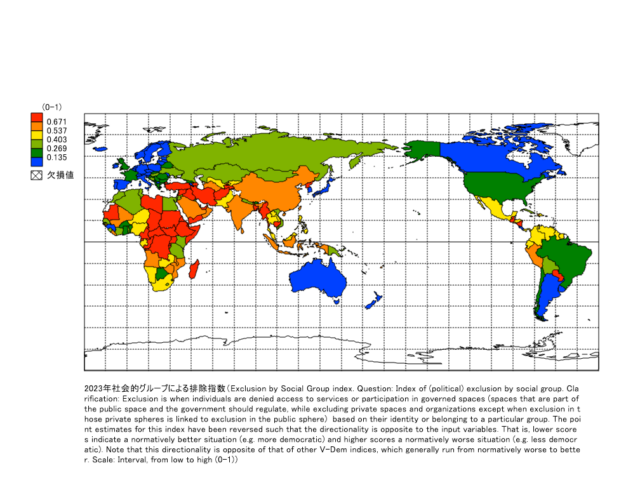
Title
Exclusion by Social Group index. Question: Index of (political) exclusion by social group. Clarification: Exclusion is when individuals are denied access to services or participation in governed spaces (spaces that are part of the public space and the government should regulate, while excluding private spaces and organizations except when exclusion in those private spheres is linked to exclusion in the public sphere) based on their identity or belonging to a particular group. The point estimates for this index have been reversed such that the directionality is opposite to the input variables. That is, lower scores indicate a normatively better situation (e.g. more democratic) and higher scores a normatively worse situation (e.g. less democratic). Note that this directionality is opposite of that of other V-Dem indices, which generally run from normatively worse to better. Scale: Interval, from low to high (0-1)
Source
Varieties of Democracy Institute (https://www.v-dem.net/data/the-v-dem-dataset/)
Google Earth
-
2023年ジェンダーによる公共サービスや空間からの排除(0から1の指数)
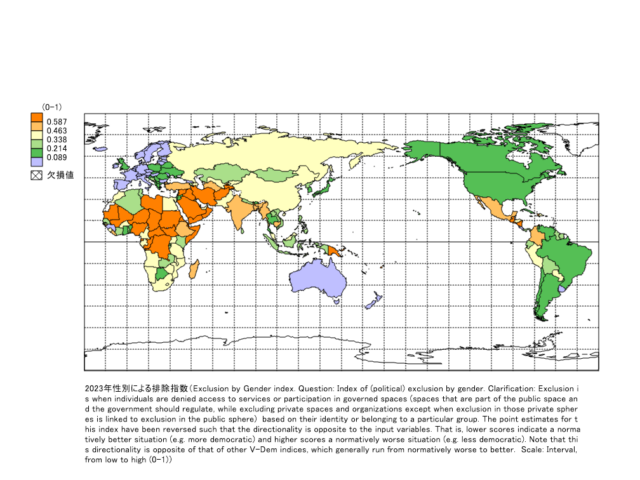
Title
Exclusion by Gender index. Question: Index of (political) exclusion by gender. Clarification: Exclusion is when individuals are denied access to services or participation in governed spaces (spaces that are part of the public space and the government should regulate, while excluding private spaces and organizations except when exclusion in those private spheres is linked to exclusion in the public sphere) based on their identity or belonging to a particular group. The point estimates for this index have been reversed such that the directionality is opposite to the input variables. That is, lower scores indicate a normatively better situation (e.g. more democratic) and higher scores a normatively worse situation (e.g. less democratic). Note that this directionality is opposite of that of other V-Dem indices, which generally run from normatively worse to better. Scale: Interval, from low to high (0-1)
Source
Varieties of Democracy Institute (https://www.v-dem.net/data/the-v-dem-dataset/)
Google Earth
-
2023年市民組織や独立したメディアは政府の説明責任を追及できるか(0から1の指数)
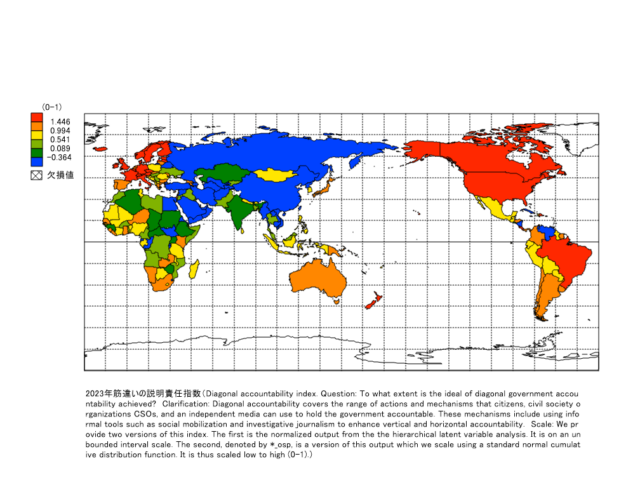
Title
Diagonal accountability index. Question: To what extent is the ideal of diagonal government accountability achieved? Clarification: Diagonal accountability covers the range of actions and mechanisms that citizens, civil society organizations CSOs, and an independent media can use to hold the government accountable. These mechanisms include using informal tools such as social mobilization and investigative journalism to enhance vertical and horizontal accountability. Scale: We provide two versions of this index. The first is the normalized output from the the hierarchical latent variable analysis. It is on an unbounded interval scale. The second, denoted by *_osp, is a version of this output which we scale using a standard normal cumulative distribution function. It is thus scaled low to high (0-1).
Source
Varieties of Democracy Institute (https://www.v-dem.net/data/the-v-dem-dataset/)
Google Earth
-
2023年特定のテーマに関する直接投票の機会はあるか(0から1の指数)
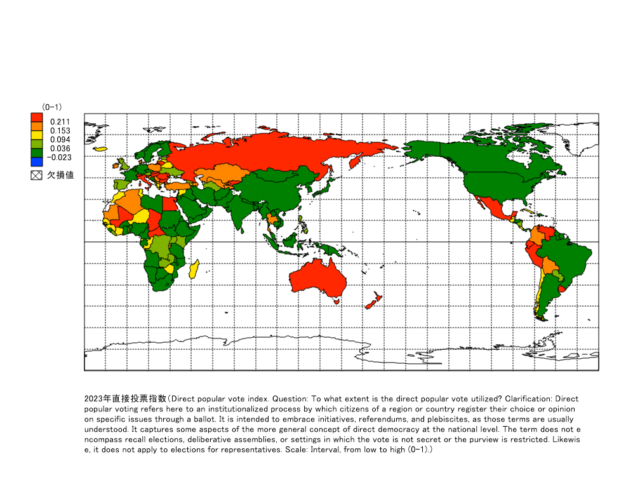
Title
Direct popular vote index. Question: To what extent is the direct popular vote utilized? Clarification: Direct popular voting refers here to an institutionalized process by which citizens of a region or country register their choice or opinion on specific issues through a ballot. It is intended to embrace initiatives, referendums, and plebiscites, as those terms are usually understood. It captures some aspects of the more general concept of direct democracy at the national level. The term does not encompass recall elections, deliberative assemblies, or settings in which the vote is not secret or the purview is restricted. Likewise, it does not apply to elections for representatives. Scale: Interval, from low to high (0-1).
Source
Varieties of Democracy Institute (https://www.v-dem.net/data/the-v-dem-dataset/)
Google Earth
-
2023年市民社会は堅牢か(市民組織の独立性.0から1の指数)
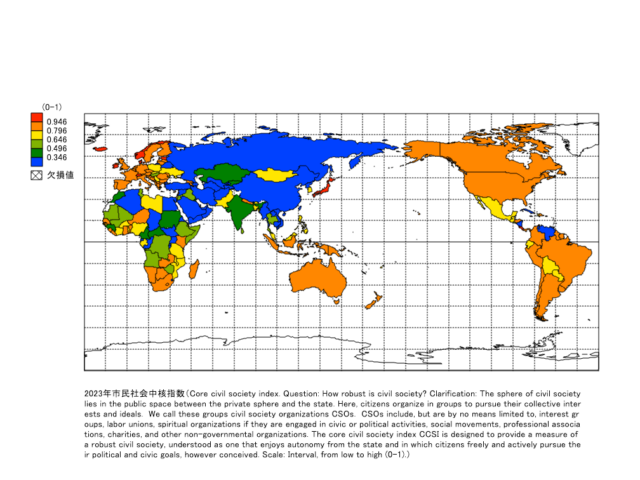
Title
Core civil society index. Question: How robust is civil society? Clarification: The sphere of civil society lies in the public space between the private sphere and the state. Here, citizens organize in groups to pursue their collective interests and ideals. We call these groups civil society organizations CSOs. CSOs include, but are by no means limited to, interest groups, labor unions, spiritual organizations if they are engaged in civic or political activities, social movements, professional associations, charities, and other non-governmental organizations. The core civil society index CCSI is designed to provide a measure of a robust civil society, understood as one that enjoys autonomy from the state and in which citizens freely and actively pursue their political and civic goals, however conceived. Scale: Interval, from low to high (0-1).
Source
Varieties of Democracy Institute (https://www.v-dem.net/data/the-v-dem-dataset/)
Google Earth
-
2023年公正な選挙がされているか(0から1の指数)
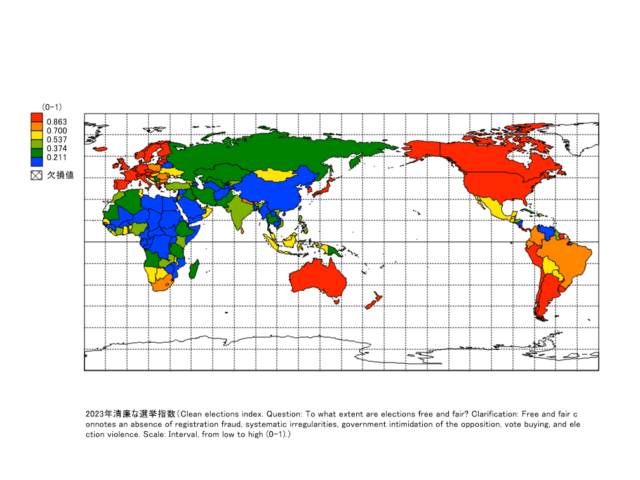
Title
Clean elections index. Question: To what extent are elections free and fair? Clarification: Free and fair connotes an absence of registration fraud, systematic irregularities, government intimidation of the opposition, vote buying, and election violence. Scale: Interval, from low to high (0-1).
Source
Varieties of Democracy Institute (https://www.v-dem.net/data/the-v-dem-dataset/)
Google Earth
-
2023年市民社会組織(労働組合やNGOなど)は政策作成に参加しているか(0から1の指数)
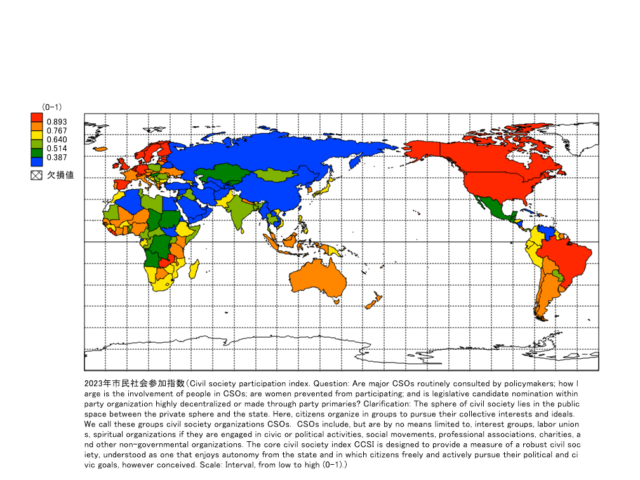
Title
Civil society participation index. Question: Are major CSOs routinely consulted by policymakers; how large is the involvement of people in CSOs; are women prevented from participating; and is legislative candidate nomination within party organization highly decentralized or made through party primaries? Clarification: The sphere of civil society lies in the public space between the private sphere and the state. Here, citizens organize in groups to pursue their collective interests and ideals. We call these groups civil society organizations CSOs. CSOs include, but are by no means limited to, interest groups, labor unions, spiritual organizations if they are engaged in civic or political activities, social movements, professional associations, charities, and other non-governmental organizations. The core civil society index CCSI is designed to provide a measure of a robust civil society, understood as one that enjoys autonomy from the state and in which citizens freely and actively pursue their political and civic goals, however conceived. Scale: Interval, from low to high (0-1).
Source
Varieties of Democracy Institute (https://www.v-dem.net/data/the-v-dem-dataset/)
Google Earth
-
2023年女性は意思を表明し市民社会に参加しているか?(0から1の指数)
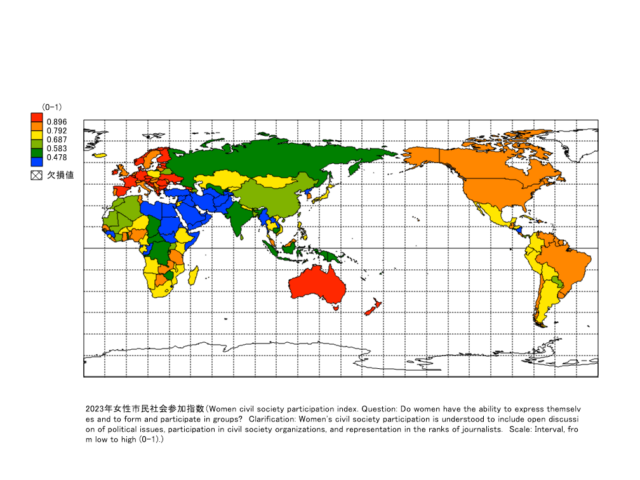
Title
Women civil society participation index. Question: Do women have the ability to express themselves and to form and participate in groups? Clarification: Women’s civil society participation is understood to include open discussion of political issues, participation in civil society organizations, and representation in the ranks of journalists. Scale: Interval, from low to high (0-1).
Source
Varieties of Democracy Institute (https://www.v-dem.net/data/the-v-dem-dataset/)
Google Earth
-
2023年議会における女性の代表制と公権力の配分(0から1の指数)
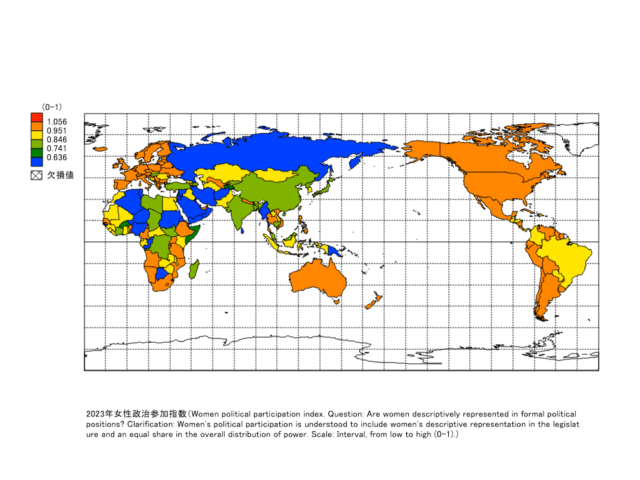
Title
Women political participation index. Question: Are women descriptively represented in formal political positions? Clarification: Women’s political participation is understood to include women’s descriptive representation in the legislature and an equal share in the overall distribution of power. Scale: Interval, from low to high (0-1).
Source
Varieties of Democracy Institute (https://www.v-dem.net/data/the-v-dem-dataset/)
Google Earth
-
2023年政治への参加は達成されているか(0から1の指数)
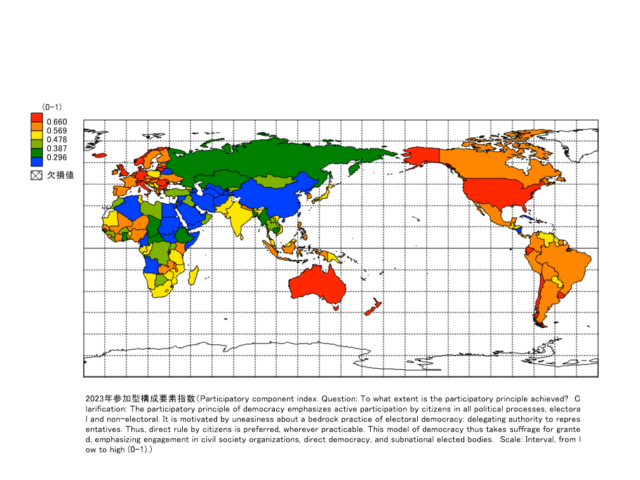
Title
Participatory component index. Question: To what extent is the participatory principle achieved? Clarification: The participatory principle of democracy emphasizes active participation by citizens in all political processes, electoral and non-electoral. It is motivated by uneasiness about a bedrock practice of electoral democracy: delegating authority to representatives. Thus, direct rule by citizens is preferred, wherever practicable. This model of democracy thus takes suffrage for granted, emphasizing engagement in civil society organizations, direct democracy, and subnational elected bodies. Scale: Interval, from low to high (0-1).
Source
Varieties of Democracy Institute (https://www.v-dem.net/data/the-v-dem-dataset/)
Google Earth
-
2022年国内避難民,紛争・暴力に伴う新たな避難民
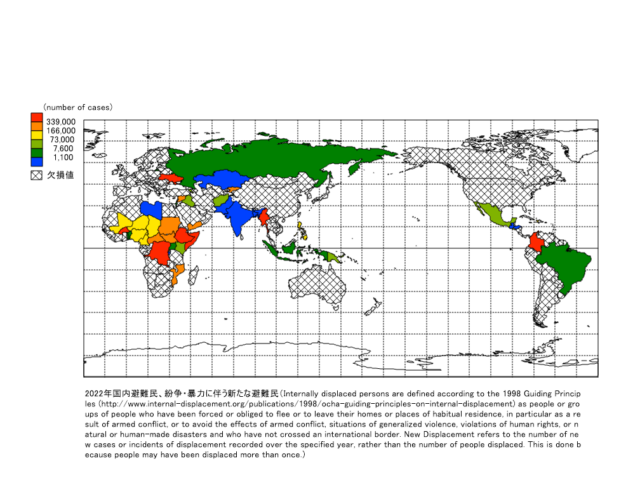
Title
Internally displaced persons are defined according to the 1998 Guiding Principles (http://www.internal-displacement.org/publications/1998/ocha-guiding-principles-on-internal-displacement) as people or groups of people who have been forced or obliged to flee or to leave their homes or places of habitual residence, in particular as a result of armed conflict, or to avoid the effects of armed conflict, situations of generalized violence, violations of human rights, or natural or human-made disasters and who have not crossed an international border. New Displacement refers to the number of new cases or incidents of displacement recorded over the specified year, rather than the number of people displaced. This is done because people may have been displaced more than once.
Source
The Internal Displacement Monitoring Centre (http://www.internal-displacement.org/)
Google Earth
-
2023年国内避難民,災害に伴う新たな避難民
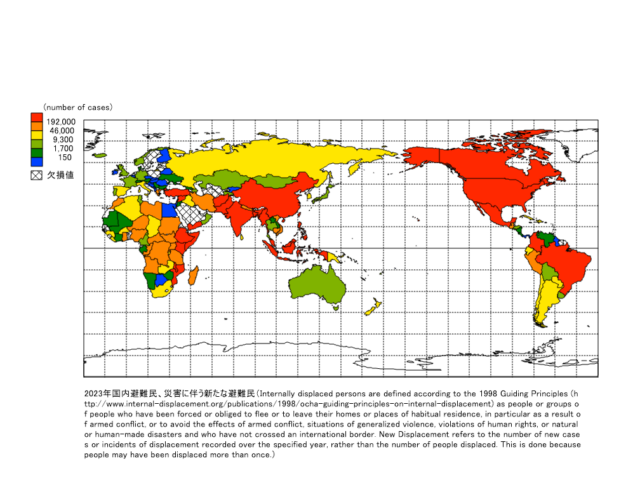
Title
Internally displaced persons are defined according to the 1998 Guiding Principles (http://www.internal-displacement.org/publications/1998/ocha-guiding-principles-on-internal-displacement) as people or groups of people who have been forced or obliged to flee or to leave their homes or places of habitual residence, in particular as a result of armed conflict, or to avoid the effects of armed conflict, situations of generalized violence, violations of human rights, or natural or human-made disasters and who have not crossed an international border. New Displacement refers to the number of new cases or incidents of displacement recorded over the specified year, rather than the number of people displaced. This is done because people may have been displaced more than once.
Source
The Internal Displacement Monitoring Centre (http://www.internal-displacement.org/)
Google Earth
-
2023年庇護国・地域別の難民人口
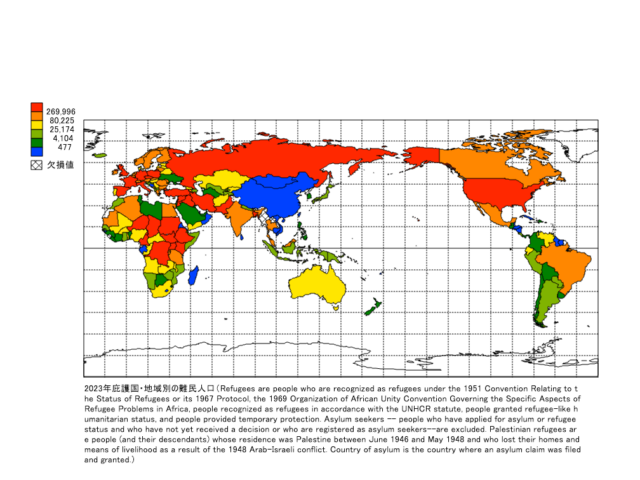
Title
Refugees are people who are recognized as refugees under the 1951 Convention Relating to the Status of Refugees or its 1967 Protocol, the 1969 Organization of African Unity Convention Governing the Specific Aspects of Refugee Problems in Africa, people recognized as refugees in accordance with the UNHCR statute, people granted refugee-like humanitarian status, and people provided temporary protection. Asylum seekers — people who have applied for asylum or refugee status and who have not yet received a decision or who are registered as asylum seekers–are excluded. Palestinian refugees are people (and their descendants) whose residence was Palestine between June 1946 and May 1948 and who lost their homes and means of livelihood as a result of the 1948 Arab-Israeli conflict. Country of asylum is the country where an asylum claim was filed and granted.
Source
United Nations High Commissioner for Refugees (UNHCR) and UNRWA through UNHCR’s Refugee Data Finder at https://www.unhcr.org/refugee-statistics/.
Google Earth
-
2022年表現や報道の自由(-2.5から2.5の推定尺度)
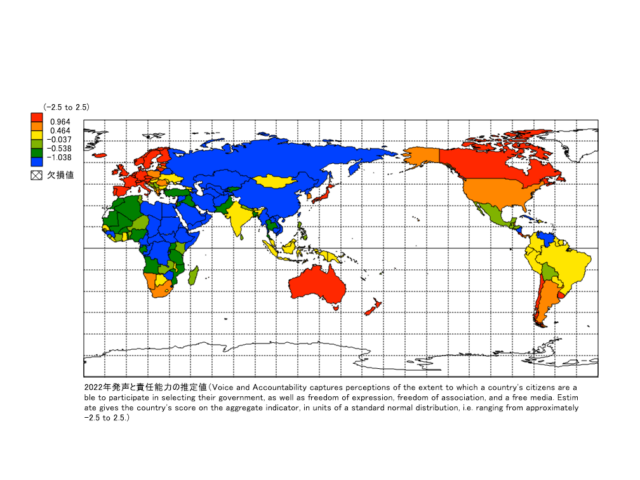
Title
Voice and Accountability captures perceptions of the extent to which a country’s citizens are able to participate in selecting their government, as well as freedom of expression, freedom of association, and a free media. Estimate gives the country’s score on the aggregate indicator, in units of a standard normal distribution, i.e. ranging from approximately -2.5 to 2.5.
Source
世界銀行 世界ガバナンス指数 複数の国における政府機関やNGOの専門家を対象としたアンケート調査などをもとに数値を標準化して統合した指数 Detailed documentation of the WGI, interactive tools for exploring the data, and full access to the underlying source data available at www.govindicators.org.The WGI are produced by Daniel Kaufmann (Natural Resource Governance Institute and Brookings Institution) and Aart Kraay (World Bank Development Research Group). Please cite Kaufmann, Daniel, Aart Kraay and Massimo Mastruzzi (2010). The Worldwide Governance Indicators: Methodology and Analytical Issues. World Bank Policy Research Working Paper No. 5430 (http://papers.ssrn.com/sol3/papers.cfm?abstract_id=1682130). The WGI do not reflect the official views of the Natural Resource Governance Institute, the Brookings Institution, the World Bank, its Executive Directors, or the countries they represent.
Google Earth
-
2021年教育や訓練を受けず,就職もしていない若者(ニート)が若者人口に占める割合
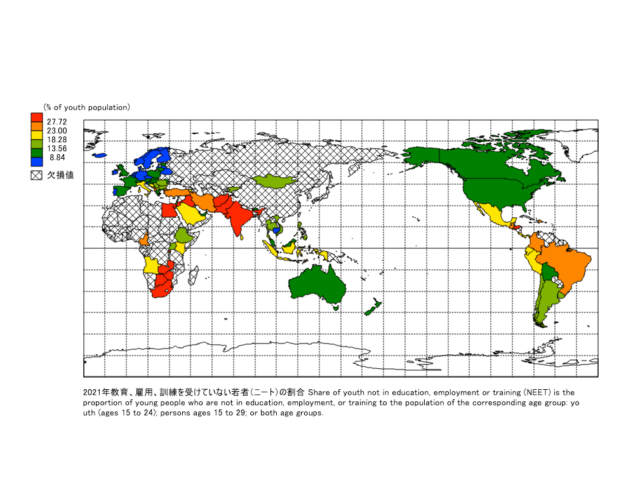
Title
Share of youth not in education, employment or training (NEET) is the proportion of young people who are not in education, employment, or training to the population of the corresponding age group: youth (ages 15 to 24); persons ages 15 to 29; or both age groups.
Source
International Labour Organization. “Labour Force Statistics database (LFS)” ILOSTAT. Accessed September 06, 2024. https://ilostat.ilo.org/data/.
Google Earth
-
2022年法治は機能しているか(-2.5から2.5の推定尺度)
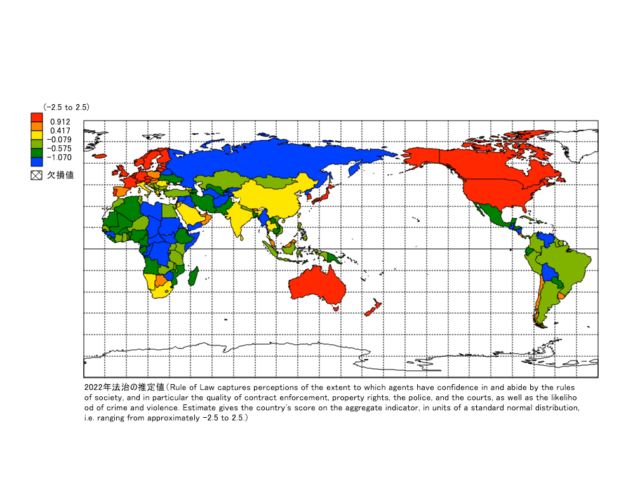
Title
Rule of Law captures perceptions of the extent to which agents have confidence in and abide by the rules of society, and in particular the quality of contract enforcement, property rights, the police, and the courts, as well as the likelihood of crime and violence. Estimate gives the country’s score on the aggregate indicator, in units of a standard normal distribution, i.e. ranging from approximately -2.5 to 2.5.
Source
世界銀行 世界ガバナンス指数 複数の国における政府機関やNGOの専門家を対象としたアンケート調査などをもとに数値を標準化して統合した指数 Detailed documentation of the WGI, interactive tools for exploring the data, and full access to the underlying source data available at www.govindicators.org.The WGI are produced by Daniel Kaufmann (Natural Resource Governance Institute and Brookings Institution) and Aart Kraay (World Bank Development Research Group). Please cite Kaufmann, Daniel, Aart Kraay and Massimo Mastruzzi (2010). The Worldwide Governance Indicators: Methodology and Analytical Issues. World Bank Policy Research Working Paper No. 5430 (http://papers.ssrn.com/sol3/papers.cfm?abstract_id=1682130). The WGI do not reflect the official views of the Natural Resource Governance Institute, the Brookings Institution, the World Bank, its Executive Directors, or the countries they represent.
Google Earth
-
2022年民間部門への規制の妥当性(-2.5から2.5の推定尺度)
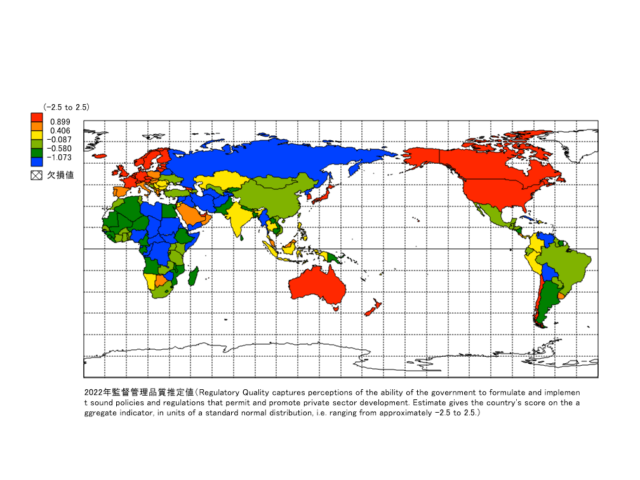
Title
Regulatory Quality captures perceptions of the ability of the government to formulate and implement sound policies and regulations that permit and promote private sector development. Estimate gives the country’s score on the aggregate indicator, in units of a standard normal distribution, i.e. ranging from approximately -2.5 to 2.5.
Source
世界銀行 世界ガバナンス指数 複数の国における政府機関やNGOの専門家を対象としたアンケート調査などをもとに数値を標準化して統合した指数 Detailed documentation of the WGI, interactive tools for exploring the data, and full access to the underlying source data available at www.govindicators.org.The WGI are produced by Daniel Kaufmann (Natural Resource Governance Institute and Brookings Institution) and Aart Kraay (World Bank Development Research Group). Please cite Kaufmann, Daniel, Aart Kraay and Massimo Mastruzzi (2010). The Worldwide Governance Indicators: Methodology and Analytical Issues. World Bank Policy Research Working Paper No. 5430 (http://papers.ssrn.com/sol3/papers.cfm?abstract_id=1682130). The WGI do not reflect the official views of the Natural Resource Governance Institute, the Brookings Institution, the World Bank, its Executive Directors, or the countries they represent.
Google Earth
-
2022年政府の効力(公共サービスの質や政治的中立性.(-2.5から2.5の推定尺度))
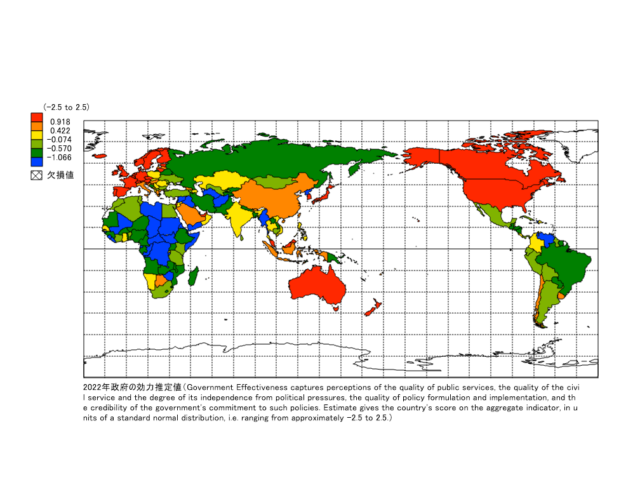
Title
Government Effectiveness captures perceptions of the quality of public services, the quality of the civil service and the degree of its independence from political pressures, the quality of policy formulation and implementation, and the credibility of the government’s commitment to such policies. Estimate gives the country’s score on the aggregate indicator, in units of a standard normal distribution, i.e. ranging from approximately -2.5 to 2.5.
Source
世界銀行 世界ガバナンス指数 複数の国における政府機関やNGOの専門家を対象としたアンケート調査などをもとに数値を標準化して統合した指数 Detailed documentation of the WGI, interactive tools for exploring the data, and full access to the underlying source data available at www.govindicators.org.The WGI are produced by Daniel Kaufmann (Natural Resource Governance Institute and Brookings Institution) and Aart Kraay (World Bank Development Research Group). Please cite Kaufmann, Daniel, Aart Kraay and Massimo Mastruzzi (2010). The Worldwide Governance Indicators: Methodology and Analytical Issues. World Bank Policy Research Working Paper No. 5430 (http://papers.ssrn.com/sol3/papers.cfm?abstract_id=1682130). The WGI do not reflect the official views of the Natural Resource Governance Institute, the Brookings Institution, the World Bank, its Executive Directors, or the countries they represent.
Google Earth
-
2022年政治的安定と暴力・テロの根絶(-2.5から2.5の推定尺度)
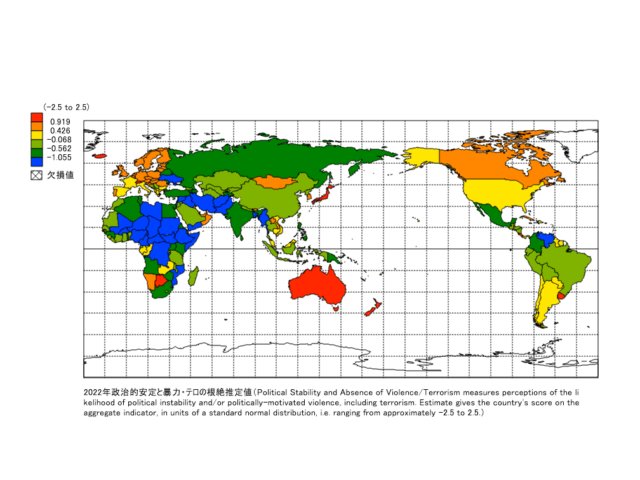
Title
Political Stability and Absence of Violence/Terrorism measures perceptions of the likelihood of political instability and/or politically-motivated violence, including terrorism. Estimate gives the country’s score on the aggregate indicator, in units of a standard normal distribution, i.e. ranging from approximately -2.5 to 2.5.
Source
世界銀行 世界ガバナンス指数 複数の国における政府機関やNGOの専門家を対象としたアンケート調査などをもとに数値を標準化して統合した指数 Detailed documentation of the WGI, interactive tools for exploring the data, and full access to the underlying source data available at www.govindicators.org.The WGI are produced by Daniel Kaufmann (Natural Resource Governance Institute and Brookings Institution) and Aart Kraay (World Bank Development Research Group). Please cite Kaufmann, Daniel, Aart Kraay and Massimo Mastruzzi (2010). The Worldwide Governance Indicators: Methodology and Analytical Issues. World Bank Policy Research Working Paper No. 5430 (http://papers.ssrn.com/sol3/papers.cfm?abstract_id=1682130). The WGI do not reflect the official views of the Natural Resource Governance Institute, the Brookings Institution, the World Bank, its Executive Directors, or the countries they represent.
Google Earth
-
2022年汚職の抑制(-2.5から2.5の推定尺度)
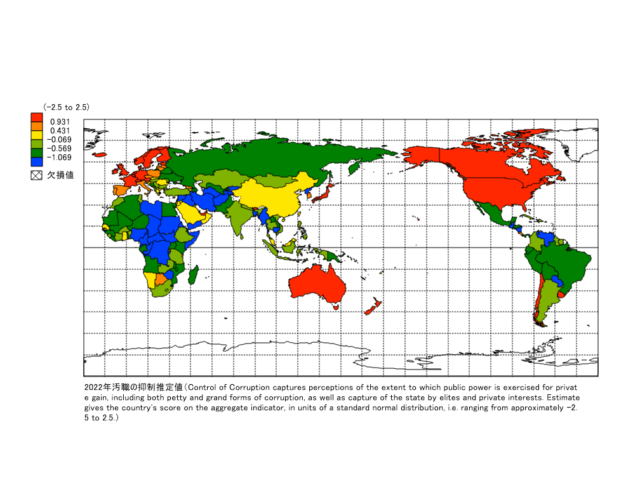
Title
Control of Corruption captures perceptions of the extent to which public power is exercised for private gain, including both petty and grand forms of corruption, as well as capture of the state by elites and private interests. Estimate gives the country’s score on the aggregate indicator, in units of a standard normal distribution, i.e. ranging from approximately -2.5 to 2.5.
Source
世界銀行 世界ガバナンス指数 複数の国における政府機関やNGOの専門家を対象としたアンケート調査などをもとに数値を標準化して統合した指数 Detailed documentation of the WGI, interactive tools for exploring the data, and full access to the underlying source data available at www.govindicators.org.The WGI are produced by Daniel Kaufmann (Natural Resource Governance Institute and Brookings Institution) and Aart Kraay (World Bank Development Research Group). Please cite Kaufmann, Daniel, Aart Kraay and Massimo Mastruzzi (2010). The Worldwide Governance Indicators: Methodology and Analytical Issues. World Bank Policy Research Working Paper No. 5430 (http://papers.ssrn.com/sol3/papers.cfm?abstract_id=1682130). The WGI do not reflect the official views of the Natural Resource Governance Institute, the Brookings Institution, the World Bank, its Executive Directors, or the countries they represent.
Google Earth
環境 Environment
災害 Disaster
Mandara
-
2017年グローバル洪水深度被害関数(最大被害インフラ 1人当たりGDP
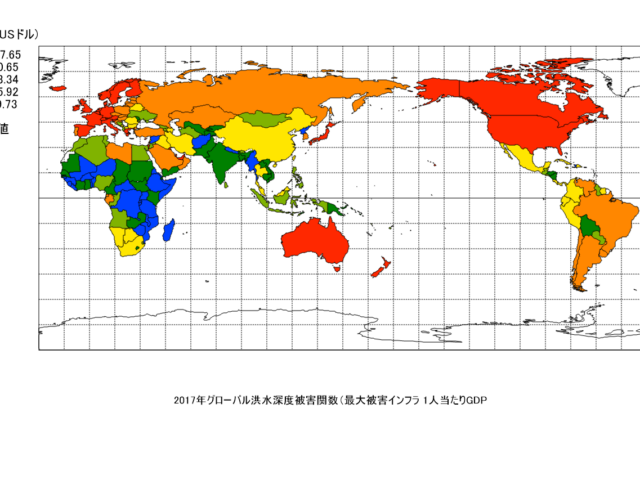
Title
2017 Global Flood Depth Damage Function (Maximum Damage Value) Infrastructure GDP per capita
Source
Global flood depth-damage functions database. European Commission JRC April 2017 (European damage functions updated in October 2017). Accompanying document to: Global flood depth-damage functions. Methodology and the database with guidelines.Huizinga J. de Moel H. Szewczyk W. (2017). Global flood depth-damage functions. Methodology and the database with guidelines.
Google Earth
-
2017年グローバル洪水深度被害関数(最大被害交通 1人当たりGDP
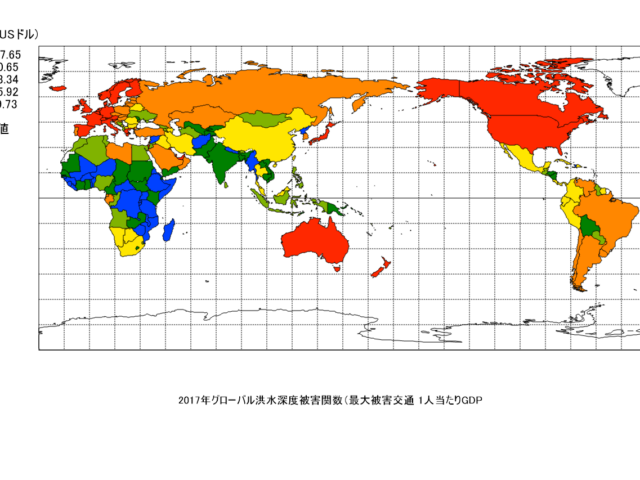
Title
2017 Global Flood Depth Damage Function (Maximum Damage) Transportation GDP per capita
Source
Global flood depth-damage functions database. European Commission JRC April 2017 (European damage functions updated in October 2017). Accompanying document to: Global flood depth-damage functions. Methodology and the database with guidelines.Huizinga J. de Moel H. Szewczyk W. (2017). Global flood depth-damage functions. Methodology and the database with guidelines.
Google Earth
-
2017年グローバル洪水深度被害関数(最大被害額農業付加価値/ヘクタール (平均 20082012 年)
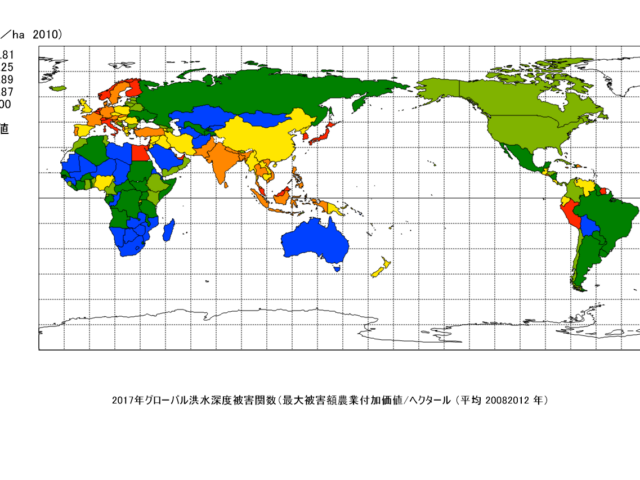
Title
2017 Global Flood Depth Damage Function (Maximum Damage Value) Agricultural Value Added per Hectare (Average 2008-2012)
Source
Global flood depth-damage functions database. European Commission JRC April 2017 (European damage functions updated in October 2017). Accompanying document to: Global flood depth-damage functions. Methodology and the database with guidelines.Huizinga J. de Moel H. Szewczyk W. (2017). Global flood depth-damage functions. Methodology and the database with guidelines.
Google Earth
-
2017年グローバル洪水深度被害関数(最大被害額農業面積 (平均 20082012 年)
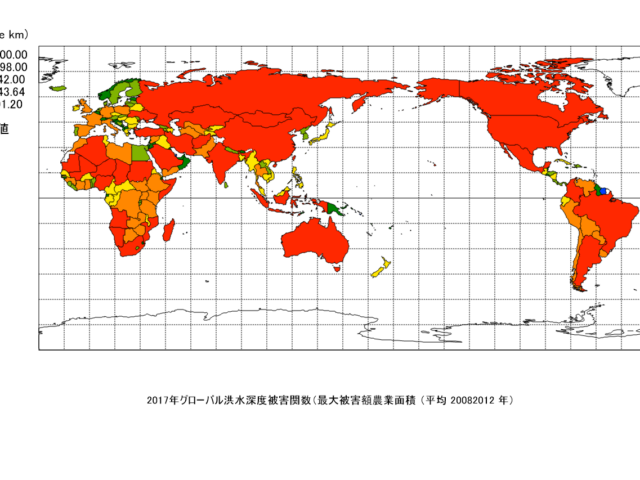
Title
2017 Global Flood Depth Damage Function (Maximum Damage Value) Agricultural Area (Average 2008-2012)
Source
Global flood depth-damage functions database. European Commission JRC April 2017 (European damage functions updated in October 2017). Accompanying document to: Global flood depth-damage functions. Methodology and the database with guidelines.Huizinga J. de Moel H. Szewczyk W. (2017). Global flood depth-damage functions. Methodology and the database with guidelines.
Google Earth
-
2017年グローバル洪水深度被害関数(工業オブジェクトベース最大被害額合計)
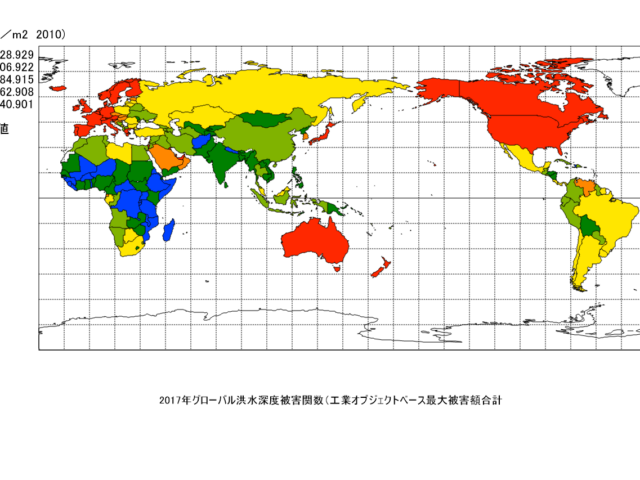
Title
2017 Global Flood Depth Damage Function (Maximum Damage Total for Industrial Objects)
Source
Global flood depth-damage functions database. European Commission JRC April 2017 (European damage functions updated in October 2017). Accompanying document to: Global flood depth-damage functions. Methodology and the database with guidelines.Huizinga J. de Moel H. Szewczyk W. (2017). Global flood depth-damage functions. Methodology and the database with guidelines.
Google Earth
-
2017年グローバル洪水深度被害関数(工業建物ベース最大被害額合計)
Title
2017 Global Flood Depth Damage Function (Maximum Damage Total for Industrial Buildings)
Source
Global flood depth-damage functions database. European Commission JRC April 2017 (European damage functions updated in October 2017). Accompanying document to: Global flood depth-damage functions. Methodology and the database with guidelines.Huizinga J. de Moel H. Szewczyk W. (2017). Global flood depth-damage functions. Methodology and the database with guidelines.
Google Earth
-
2017年グローバル洪水深度被害関数(工業土地利用ベース最大被害額合計)
Title
2017 Global Flood Depth Damage Function (Maximum Damage Total for Industrial Land Use)
Source
Global flood depth-damage functions database. European Commission JRC April 2017 (European damage functions updated in October 2017). Accompanying document to: Global flood depth-damage functions. Methodology and the database with guidelines.Huizinga J. de Moel H. Szewczyk W. (2017). Global flood depth-damage functions. Methodology and the database with guidelines.
Google Earth
-
2017年グローバル洪水深度被害関数(商業土地利用ベース最大被害額合計)
Title
2017 Global Flood Depth Damage Function (Total Maximum Damage Amount Based on Commercial Land Use)
Source
Global flood depth-damage functions database. European Commission JRC April 2017 (European damage functions updated in October 2017). Accompanying document to: Global flood depth-damage functions. Methodology and the database with guidelines.Huizinga J. de Moel H. Szewczyk W. (2017). Global flood depth-damage functions. Methodology and the database with guidelines.
Google Earth
-
2017年グローバル洪水深度被害関数(商業オブジェクトベース最大被害額合計)
Title
2017 Global Flood Depth Damage Function (Maximum Damage Total for Commercial Objects)
Source
Global flood depth-damage functions database. European Commission JRC April 2017 (European damage functions updated in October 2017). Accompanying document to: Global flood depth-damage functions. Methodology and the database with guidelines.Huizinga J. de Moel H. Szewczyk W. (2017). Global flood depth-damage functions. Methodology and the database with guidelines.
Google Earth
-
2017年グローバル洪水深度被害関数(商業建物ベース最大被害額合計)
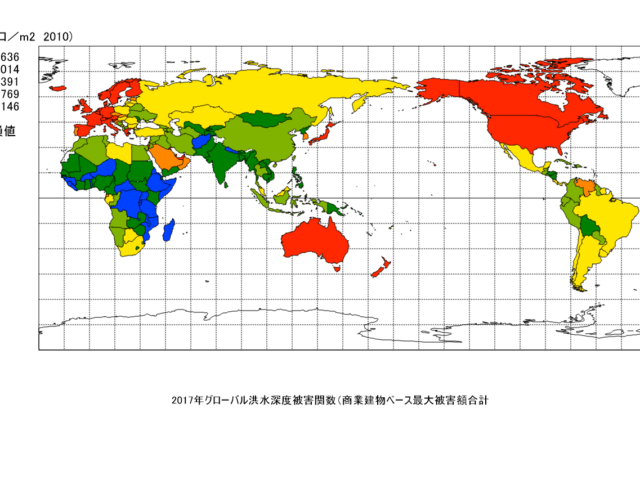
Title
2017 Global Flood Depth Damage Function (Total Maximum Damage Amount Based on Commercial Buildings)
Source
Global flood depth-damage functions database. European Commission JRC April 2017 (European damage functions updated in October 2017). Accompanying document to: Global flood depth-damage functions. Methodology and the database with guidelines.Huizinga J. de Moel H. Szewczyk W. (2017). Global flood depth-damage functions. Methodology and the database with guidelines.
Google Earth
-
2017年グローバル洪水深度被害関数(住宅建物ベース最大被害額合計)
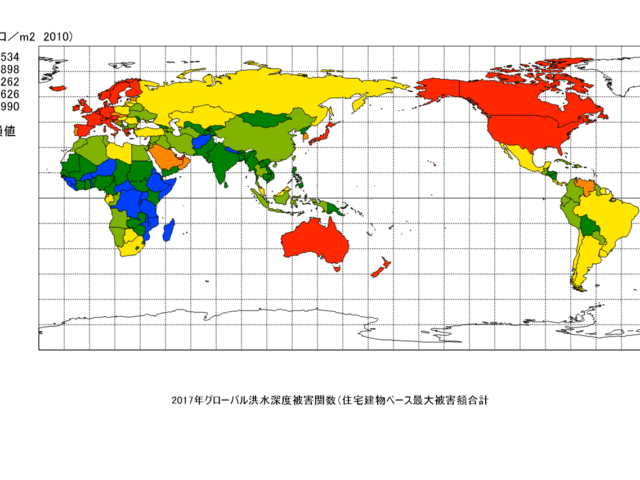
Title
2017 Global Flood Depth Damage Function (Total Maximum Damage Amount Based on Residential Buildings)
Source
Global flood depth-damage functions database. European Commission JRC April 2017 (European damage functions updated in October 2017). Accompanying document to: Global flood depth-damage functions. Methodology and the database with guidelines.Huizinga J. de Moel H. Szewczyk W. (2017). Global flood depth-damage functions. Methodology and the database with guidelines.
Google Earth
-
2017年グローバル洪水深度被害関数(住宅土地利用ベース最大被害額合計)
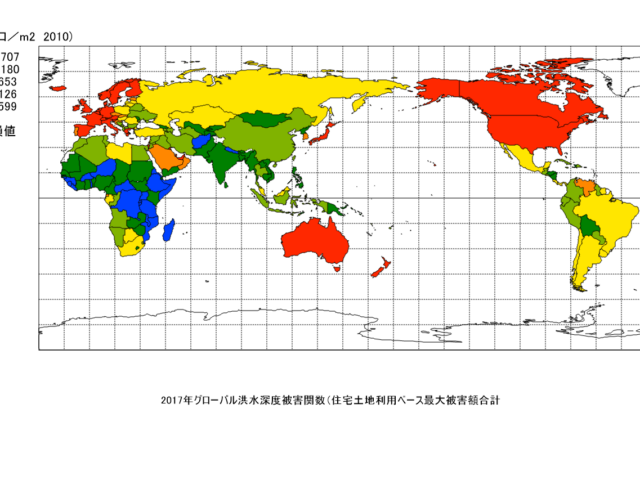
Title
2017 Global Flood Depth Damage Function (Total Maximum Damage Amount Based on Residential Land Use)
Source
Global flood depth-damage functions database. European Commission JRC April 2017 (European damage functions updated in October 2017). Accompanying document to: Global flood depth-damage functions. Methodology and the database with guidelines.Huizinga J. de Moel H. Szewczyk W. (2017). Global flood depth-damage functions. Methodology and the database with guidelines.
Google Earth
-
2011年災害リスク削減の進捗スコア
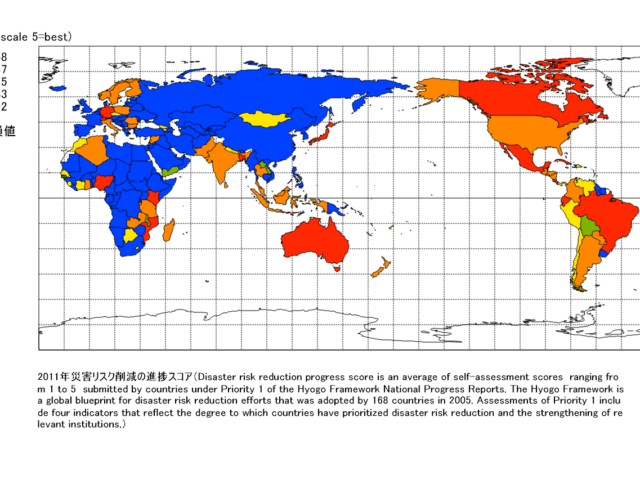
Title
Disaster risk reduction progress score is an average of self-assessment scores ranging from 1 to 5 submitted by countries under Priority 1 of the Hyogo Framework National Progress Reports. The Hyogo Framework is a global blueprint for disaster risk reduction efforts that was adopted by 168 countries in 2005. Assessments of Priority 1 include four indicators that reflect the degree to which countries have prioritized disaster risk reduction and the strengthening of relevant institutions.)
Source
UNISDR 2009-2011 Progress Reports http://www.preventionweb.net/english/hyogo
Google Earth
-
2017年グローバル洪水深度被害関数(住宅オブジェクトベース最大被害額合計)
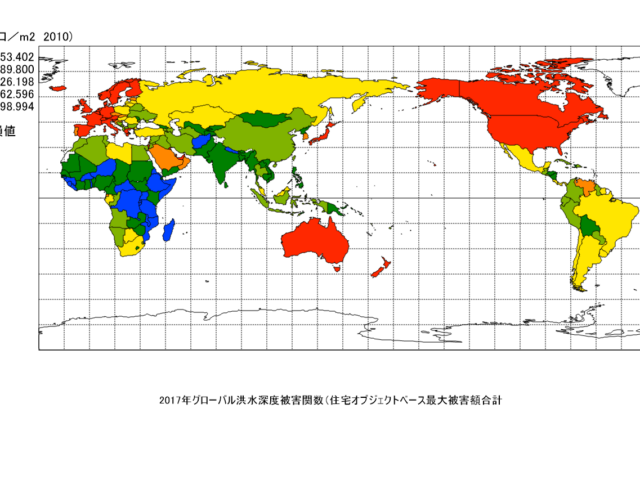
Title
2017 Global Flood Depth Damage Function (Total Maximum Damage Amount Based on Residential Objects)
Source
Global flood depth-damage functions database. European Commission JRC April 2017 (European damage functions updated in October 2017). Accompanying document to: Global flood depth-damage functions. Methodology and the database with guidelines.Huizinga J. de Moel H. Szewczyk W. (2017). Global flood depth-damage functions. Methodology and the database with guidelines.
Google Earth
-
2019年PM2.5大気汚染、年間平均暴露量
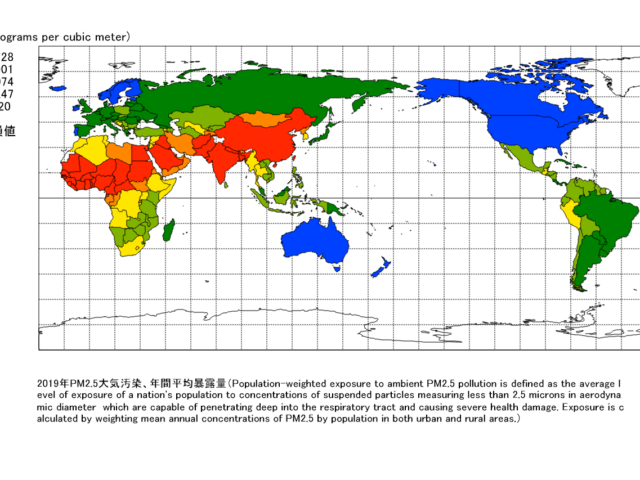
Title
Population-weighted exposure to ambient PM2.5 pollution is defined as the average level of exposure of a nation’s population to concentrations of suspended particles measuring less than 2.5 microns in aerodynamic diameter which are capable of penetrating deep into the respiratory tract and causing severe health damage. Exposure is calculated by weighting mean annual concentrations of PM2.5 by population in both urban and rural areas.
Source
Global Burden of Disease Collaborative Network. 2021. Global Burden of Disease Study 2019 (GBD 2019) Air Pollution Exposure Estimates 1990-2019. Seattle United States of America: Institute for Health Metrics and Evaluation (IHME). https://doi.org/10.6069/70JS-NC54
Google Earth
-
2021年地表温度
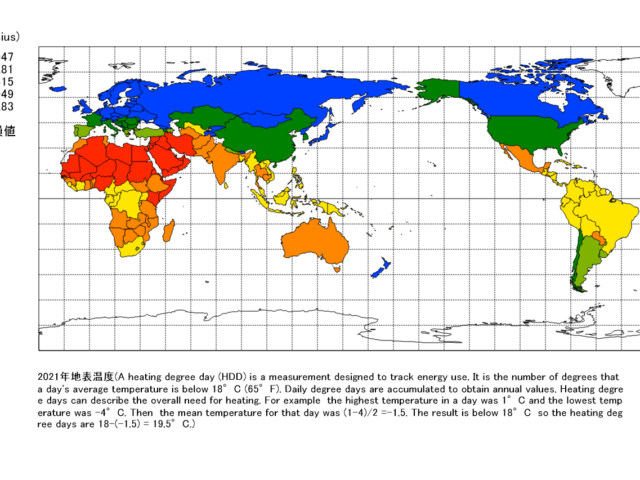
Title
A heating degree day (HDD) is a measurement designed to track energy use. It is the number of degrees that a day’s average temperature is below 18°C (65°F). Daily degree days are accumulated to obtain annual values. Heating degree days can describe the overall need for heating. For example the highest temperature in a day was 1°C and the lowest temperature was -4°C. Then the mean temperature for that day was (1-4)/2 =-1.5. The result is below 18°C so the heating degree days are 18-(-1.5) = 19.5°C.
Source
European Space Agency. https://climate.esa.int/en/projects/land-surface-temperature/
Google Earth
-
2021年水ストレスのレベル:利用可能な淡水資源に占める淡水取水の割合
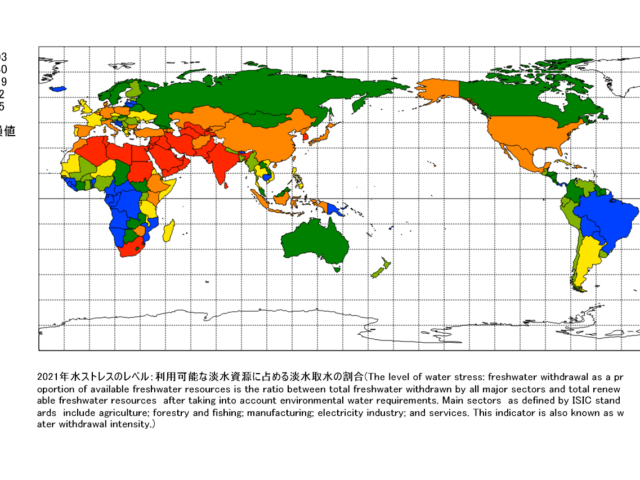
Title
The level of water stress: freshwater withdrawal as a proportion of available freshwater resources is the ratio between total freshwater withdrawn by all major sectors and total renewable freshwater resources after taking into account environmental water requirements. Main sectors as defined by ISIC standards include agriculture; forestry and fishing; manufacturing; electricity industry; and services. This indicator is also known as water withdrawal intensity.
Source
Food and Agriculture Organization AQUASTAT data.
Google Earth
-
2020年暑さ指数35
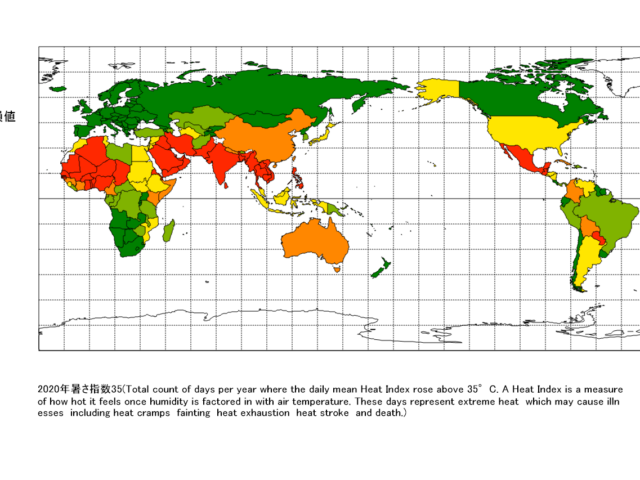
Title
Total count of days per year where the daily mean Heat Index rose above 35°C. A Heat Index is a measure of how hot it feels once humidity is factored in with air temperature. These days represent extreme heat which may cause illnesses including heat cramps fainting heat exhaustion heat stroke and death.
Source
World Bank Climate Change Knowledge Portal. https://climateknowledgeportal.worldbank.org
Google Earth
-
2020年暖房稼動日数
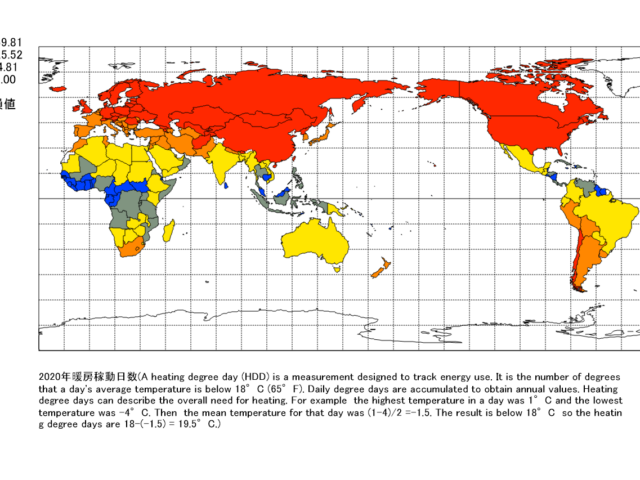
Title
A heating degree day (HDD) is a measurement designed to track energy use. It is the number of degrees that a day’s average temperature is below 18°C (65°F). Daily degree days are accumulated to obtain annual values. Heating degree days can describe the overall need for heating. For example the highest temperature in a day was 1°C and the lowest temperature was -4°C. Then the mean temperature for that day was (1-4)/2 =-1.5. The result is below 18°C so the heating degree days are 18-(-1.5) = 19.5°C.
Source
World Bank Climate Change Knowledge Portal. https://climateknowledgeportal.worldbank.org
Google Earth
-
2020年冷房日数
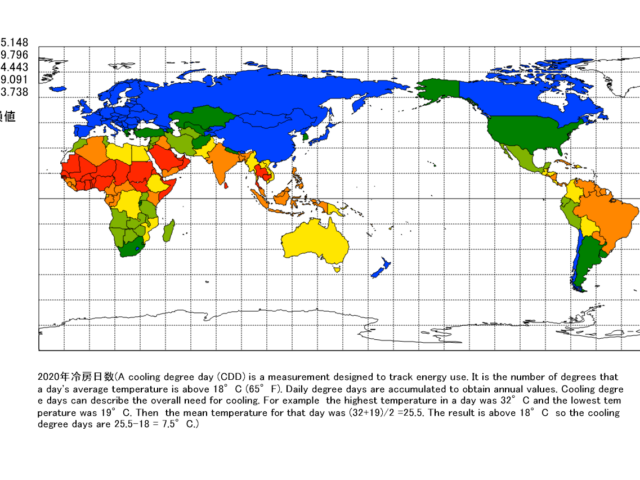
Title
A cooling degree day (CDD) is a measurement designed to track energy use. It is the number of degrees that a day’s average temperature is above 18°C (65°F). Daily degree days are accumulated to obtain annual values. Cooling degree days can describe the overall need for cooling. For example the highest temperature in a day was 32°C and the lowest temperature was 19°C. Then the mean temperature for that day was (32+19)/2 =25.5. The result is above 18°C so the cooling degree days are 25.5-18 = 7.5°C.
Source
World Bank Climate Change Knowledge Portal. https://climateknowledgeportal.worldbank.org
Google Earth
-
2022年国内避難民、紛争・暴力に伴う新たな避難民
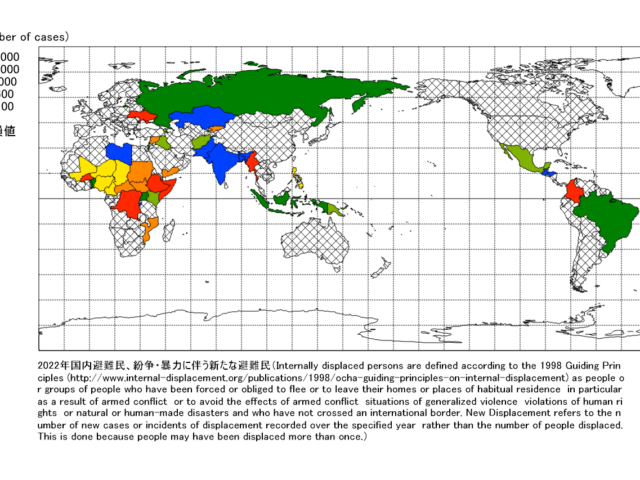
Title
Internally displaced persons are defined according to the 1998 Guiding Principles (http://www.internal-displacement.org/publications/1998/ocha-guiding-principles-on-internal-displacement) as people or groups of people who have been forced or obliged to flee or to leave their homes or places of habitual residence in particular as a result of armed conflict or to avoid the effects of armed conflict situations of generalized violence violations of human rights or natural or human-made disasters and who have not crossed an international border. New Displacement refers to the number of new cases or incidents of displacement recorded over the specified year rather than the number of people displaced. This is done because people may have been displaced more than once.
Source
The Internal Displacement Monitoring Centre (http://www.internal-displacement.org/)
Google Earth
-
2023年国内避難民、災害に伴う新たな避難民
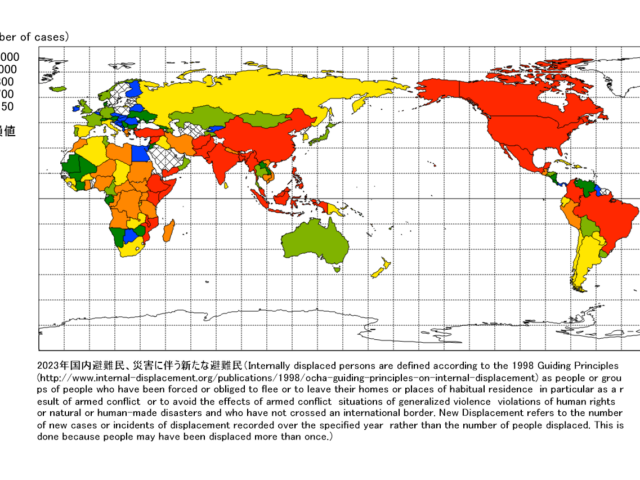
Title
Internally displaced persons are defined according to the 1998 Guiding Principles (http://www.internal-displacement.org/publications/1998/ocha-guiding-principles-on-internal-displacement) as people or groups of people who have been forced or obliged to flee or to leave their homes or places of habitual residence in particular as a result of armed conflict or to avoid the effects of armed conflict situations of generalized violence violations of human rights or natural or human-made disasters and who have not crossed an international border. New Displacement refers to the number of new cases or incidents of displacement recorded over the specified year rather than the number of people displaced. This is done because people may have been displaced more than once.
Source
The Internal Displacement Monitoring Centre (http://www.internal-displacement.org/)
Google Earth
-
2023年庇護国・地域別の難民人口
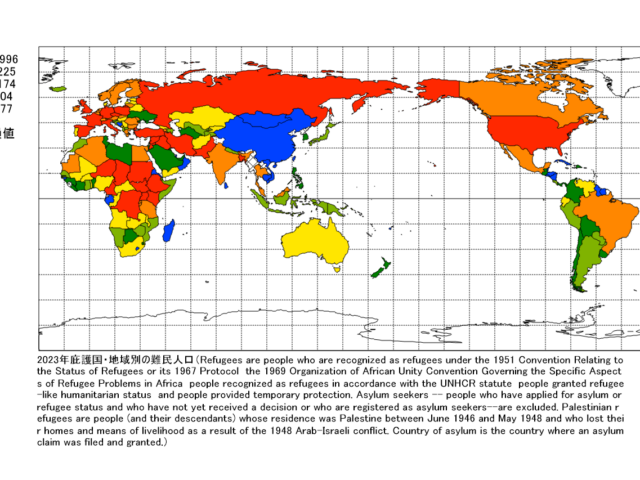
Title
Refugees are people who are recognized as refugees under the 1951 Convention Relating to the Status of Refugees or its 1967 Protocol the 1969 Organization of African Unity Convention Governing the Specific Aspects of Refugee Problems in Africa people recognized as refugees in accordance with the UNHCR statute people granted refugee-like humanitarian status and people provided temporary protection. Asylum seekers — people who have applied for asylum or refugee status and who have not yet received a decision or who are registered as asylum seekers–are excluded. Palestinian refugees are people (and their descendants) whose residence was Palestine between June 1946 and May 1948 and who lost their homes and means of livelihood as a result of the 1948 Arab-Israeli conflict. Country of asylum is the country where an asylum claim was filed and granted.
Source
United Nations High Commissioner for Refugees (UNHCR) and UNRWA through UNHCR’s Refugee Data Finder at https://www.unhcr.org/refugee-statistics/.
Google Earth
環境 Environment
Mandara
-
2021石油レント(対GDP比)
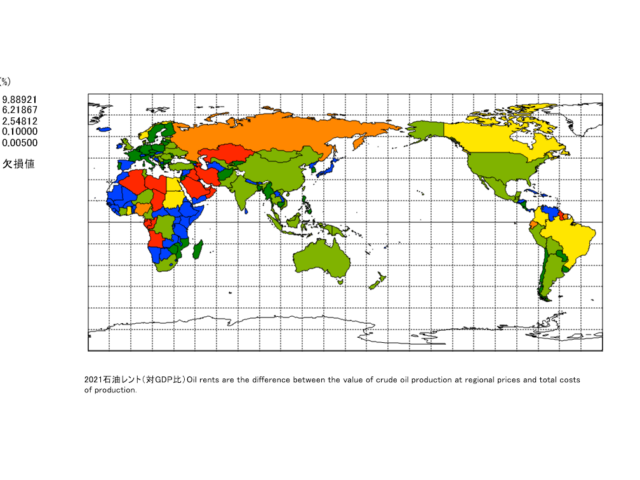
Title
Oil rents are the difference between the value of crude oil production at regional prices and total costs of production.
Source
World Bank staff estimates based on sources and methods described in the World Bank’s The Changing Wealth of Nations.
Google Earth
-
2021天然ガス レント(対GDP比)
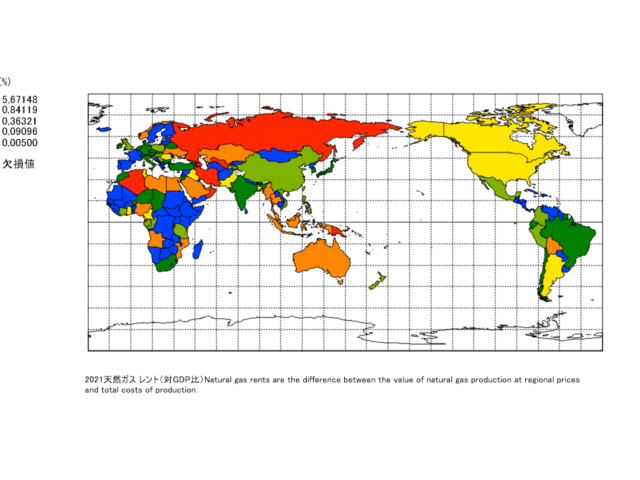
Title
Natural gas rents are the difference between the value of natural gas production at regional prices and total costs of production.
Source
World Bank staff estimates based on sources and methods described in the World Bank’s The Changing Wealth of Nations.
Google Earth
-
2021鉱物レント(対GDP比)
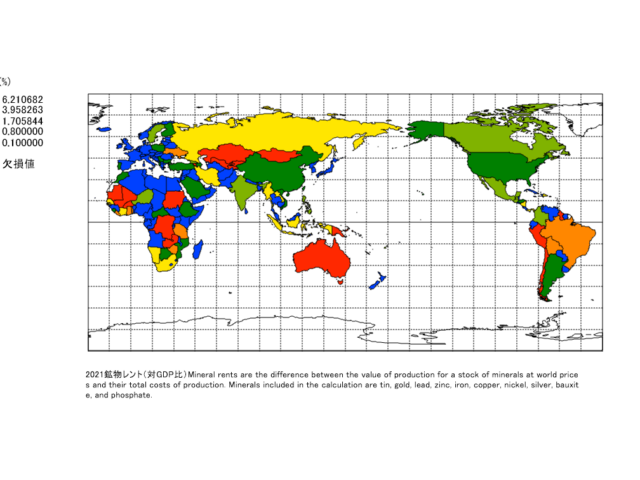
Title
Mineral rents are the difference between the value of production for a stock of minerals at world prices and their total costs of production. Minerals included in the calculation are tin, gold, lead, zinc, iron, copper, nickel, silver, bauxite, and phosphate.
Source
World Bank staff estimates based on sources and methods described in the World Bank’s The Changing Wealth of Nations.
Google Earth
-
2021石炭レント(対GDP比)
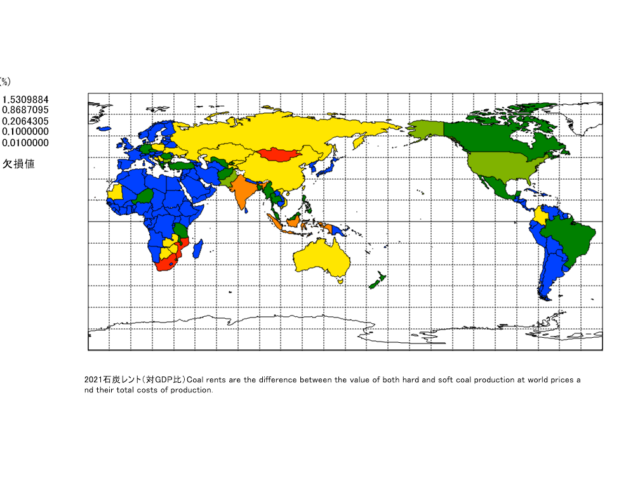
Title
Coal rents are the difference between the value of both hard and soft coal production at world prices and their total costs of production.
Source
World Bank staff estimates based on sources and methods described in the World Bank’s The Changing Wealth of Nations.
Google Earth
-
2021天然資源レントの総額(対GDP比)
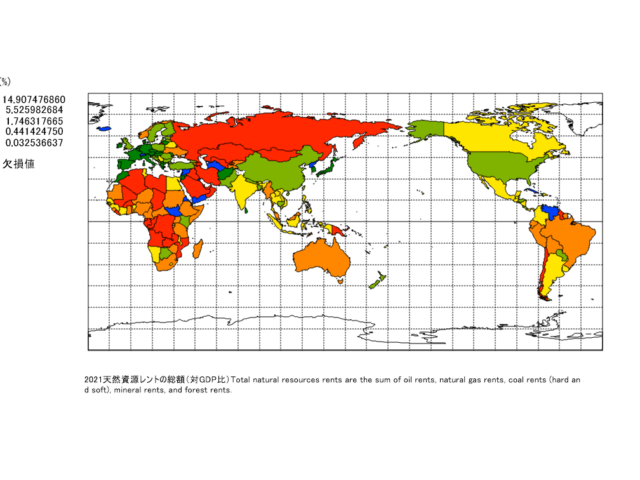
Title
Total natural resources rents are the sum of oil rents, natural gas rents, coal rents (hard and soft), mineral rents, and forest rents.
Source
World Bank staff estimates based on sources and methods described in the World Bank’s The Changing Wealth of Nations.
Google Earth
-
2022年LULUCFを除く温室効果ガス総排出量(1990年からの変化率)
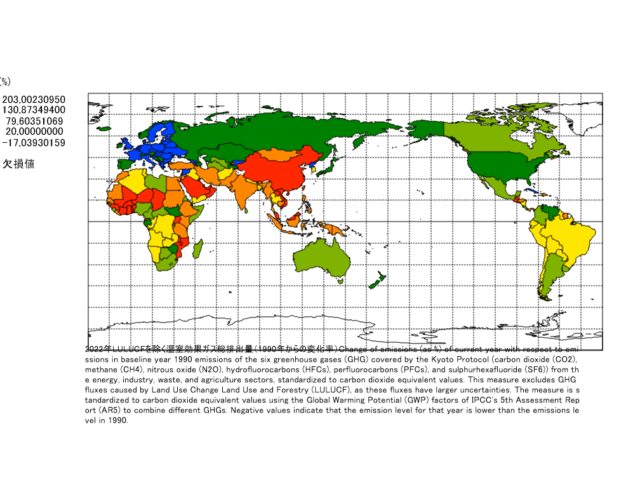
Title
Change of emissions (as %) of current year with respect to emissions in baseline year 1990 emissions of the six greenhouse gases (GHG) covered by the Kyoto Protocol (carbon dioxide (CO2), methane (CH4), nitrous oxide (N2O), hydrofluorocarbons (HFCs), perfluorocarbons (PFCs), and sulphurhexafluoride (SF6)) from the energy, industry, waste, and agriculture sectors, standardized to carbon dioxide equivalent values. This measure excludes GHG fluxes caused by Land Use Change Land Use and Forestry (LULUCF), as these fluxes have larger uncertainties. The measure is standardized to carbon dioxide equivalent values using the Global Warming Potential (GWP) factors of IPCC’s 5th Assessment Report (AR5) to combine different GHGs. Negative values indicate that the emission level for that year is lower than the emissions level in 1990.
Source
EDGAR (Emissions Database for Global Atmospheric Research) Community GHG Database, a collaboration between the European Commission, Joint Research Centre (JRC), the International Energy Agency (IEA), and comprising IEA-EDGAR CO2, EDGAR CH4, EDGAR N2O, EDGAR F-GASES version 8.0, (2023) European Commission, JRC (Datasets). https://edgar.jrc.ec.europa.eu/dataset_ghg80
Google Earth
-
2022年LULUCFを除く亜酸化窒素(N2O)排出量(合計)(1990年からの変化率)
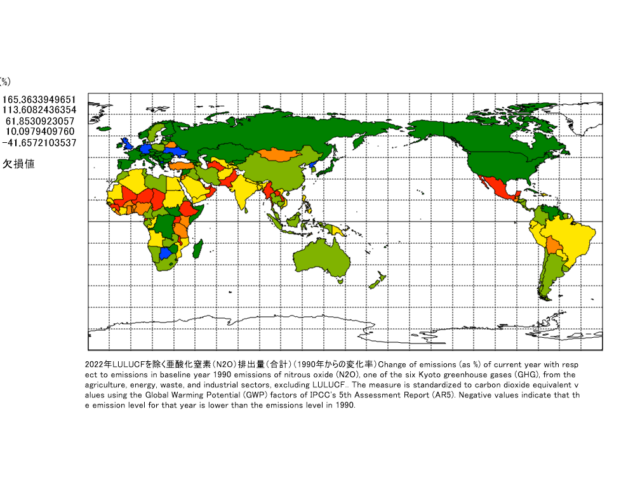
Title
Change of emissions (as %) of current year with respect to emissions in baseline year 1990 emissions of nitrous oxide (N2O), one of the six Kyoto greenhouse gases (GHG), from the agriculture, energy, waste, and industrial sectors, excluding LULUCF.. The measure is standardized to carbon dioxide equivalent values using the Global Warming Potential (GWP) factors of IPCC’s 5th Assessment Report (AR5). Negative values indicate that the emission level for that year is lower than the emissions level in 1990.
Source
EDGAR (Emissions Database for Global Atmospheric Research) Community GHG Database, a collaboration between the European Commission, Joint Research Centre (JRC), the International Energy Agency (IEA), and comprising IEA-EDGAR CO2, EDGAR CH4, EDGAR N2O, EDGAR F-GASES version 8.0, (2023) European Commission, JRC (Datasets). https://edgar.jrc.ec.europa.eu/dataset_ghg80
Google Earth
-
2022年LULUCFを除く温室効果ガス総排出量(Mt-CO2e)
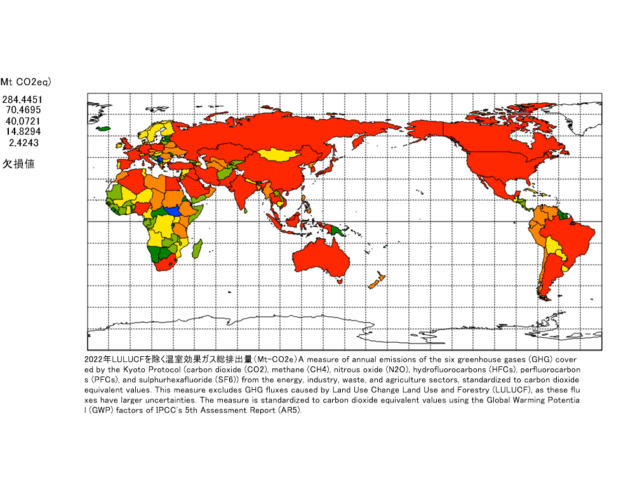
Title
A measure of annual emissions of the six greenhouse gases (GHG) covered by the Kyoto Protocol (carbon dioxide (CO2), methane (CH4), nitrous oxide (N2O), hydrofluorocarbons (HFCs), perfluorocarbons (PFCs), and sulphurhexafluoride (SF6)) from the energy, industry, waste, and agriculture sectors, standardized to carbon dioxide equivalent values. This measure excludes GHG fluxes caused by Land Use Change Land Use and Forestry (LULUCF), as these fluxes have larger uncertainties. The measure is standardized to carbon dioxide equivalent values using the Global Warming Potential (GWP) factors of IPCC’s 5th Assessment Report (AR5).
Source
EDGAR (Emissions Database for Global Atmospheric Research) Community GHG Database, a collaboration between the European Commission, Joint Research Centre (JRC), the International Energy Agency (IEA), and comprising IEA-EDGAR CO2, EDGAR CH4, EDGAR N2O, EDGAR F-GASES version 8.0, (2023) European Commission, JRC (Datasets). https://edgar.jrc.ec.europa.eu/dataset_ghg72
Google Earth
-
2021陸域および海域の保護地域(総領土面積に占める割合)
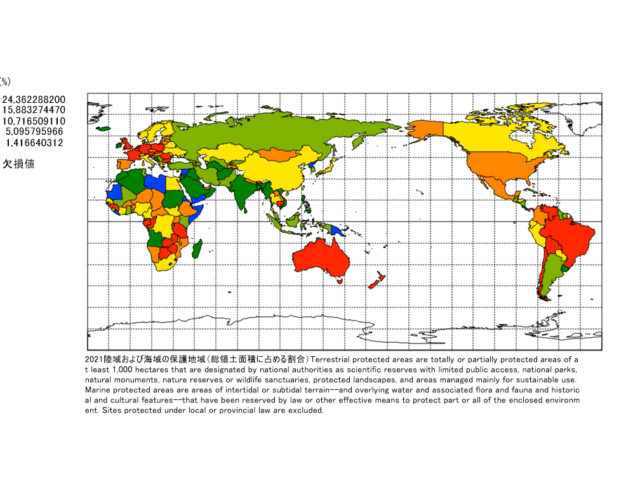
Title
Terrestrial protected areas are totally or partially protected areas of at least 1,000 hectares that are designated by national authorities as scientific reserves with limited public access, national parks, natural monuments, nature reserves or wildlife sanctuaries, protected landscapes, and areas managed mainly for sustainable use. Marine protected areas are areas of intertidal or subtidal terrain–and overlying water and associated flora and fauna and historical and cultural features–that have been reserved by law or other effective means to protect part or all of the enclosed environment. Sites protected under local or provincial law are excluded.
Source
World Database on Protected Areas (WDPA) where the compilation and management is carried out by United Nations Environment World Conservation Monitoring Centre (UNEP-WCMC) in collaboration with governments, non-governmental organizations, academia and industry. The data is available online through the Protected Planet website (https://www.protectedplanet.net/).
Google Earth
-
2021陸上保護地域(総面積に占める割合)
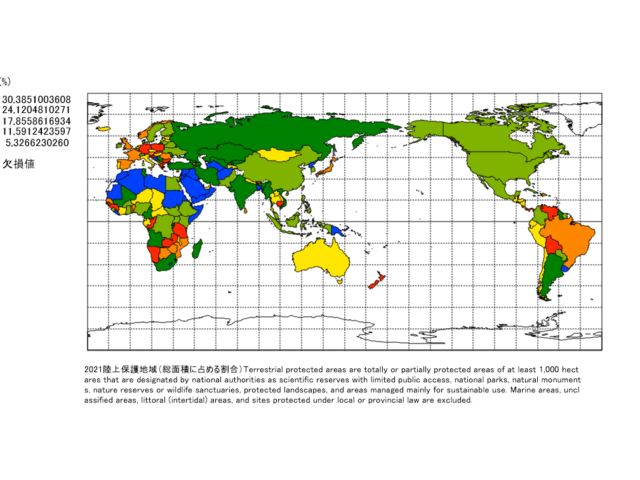
Title
Terrestrial protected areas are totally or partially protected areas of at least 1,000 hectares that are designated by national authorities as scientific reserves with limited public access, national parks, natural monuments, nature reserves or wildlife sanctuaries, protected landscapes, and areas managed mainly for sustainable use. Marine areas, unclassified areas, littoral (intertidal) areas, and sites protected under local or provincial law are excluded.
Source
World Database on Protected Areas (WDPA) where the compilation and management is carried out by United Nations Environment World Conservation Monitoring Centre (UNEP-WCMC) in collaboration with governments, non-governmental organizations, academia and industry. The data is available online through the Protected Planet website (https://www.protectedplanet.net/).
Google Earth
-
2018植物種(高等種)、絶滅危惧種
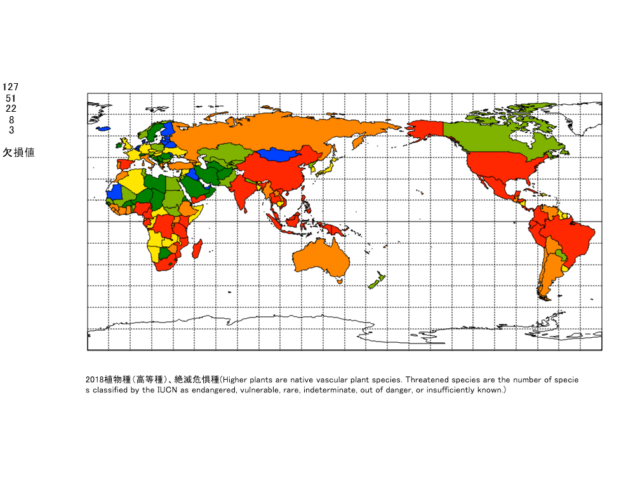
Title
(Higher plants are native vascular plant species. Threatened species are the number of species classified by the IUCN as endangered, vulnerable, rare, indeterminate, out of danger, or insufficiently known.)
Source
United Nations Environmental Program and the World Conservation Monitoring Centre, and International Union for Conservation of Nature, Red List of Threatened Species.
Google Earth
-
2017年PM2.5大気汚染、WHOガイドライン値を超えるレベルにさらされた人口(全体に占める割合)
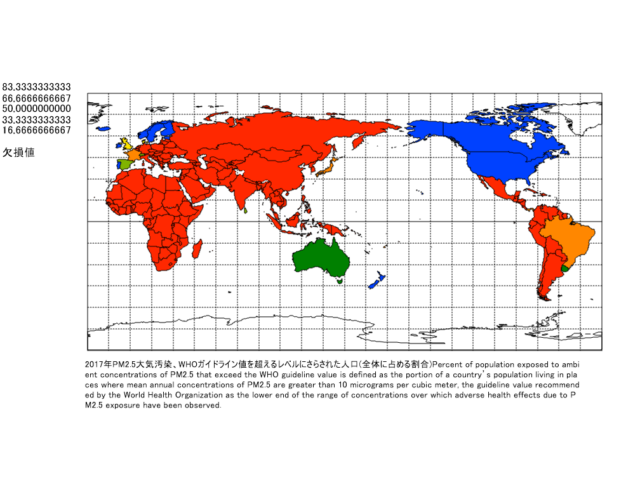
Title
Percent of population exposed to ambient concentrations of PM2.5 that exceed the WHO guideline value is defined as the portion of a country’s population living in places where mean annual concentrations of PM2.5 are greater than 10 micrograms per cubic meter, the guideline value recommended by the World Health Organization as the lower end of the range of concentrations over which adverse health effects due to PM2.5 exposure have been observed.
Source
Brauer, M. et al. 2017, for the Global Burden of Disease Study 2017.
Google Earth
-
2021海洋保護区(領海に占める割合)
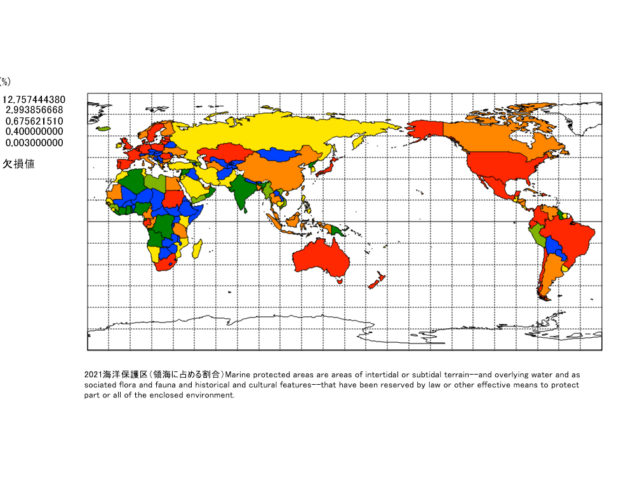
Title
Marine protected areas are areas of intertidal or subtidal terrain–and overlying water and associated flora and fauna and historical and cultural features–that have been reserved by law or other effective means to protect part or all of the enclosed environment.
Source
World Database on Protected Areas (WDPA) where the compilation and management is carried out by United Nations Environment World Conservation Monitoring Centre (UNEP-WCMC) in collaboration with governments, non-governmental organizations, academia and industry. The data is available online through the Protected Planet website (https://www.protectedplanet.net/).
Google Earth
-
2015化石燃料エネルギー消費量(総エネルギー消費量に占める割合)
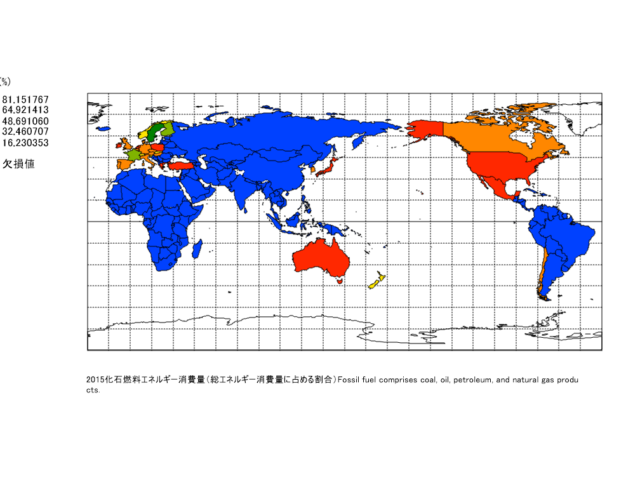
Title
Fossil fuel comprises coal, oil, petroleum, and natural gas products.
Source
IEA Statistics © OECD/IEA 2014 (https://www.iea.org/data-and-statistics), subject to https://www.iea.org/terms/
Google Earth
-
2018哺乳類、絶滅危惧種
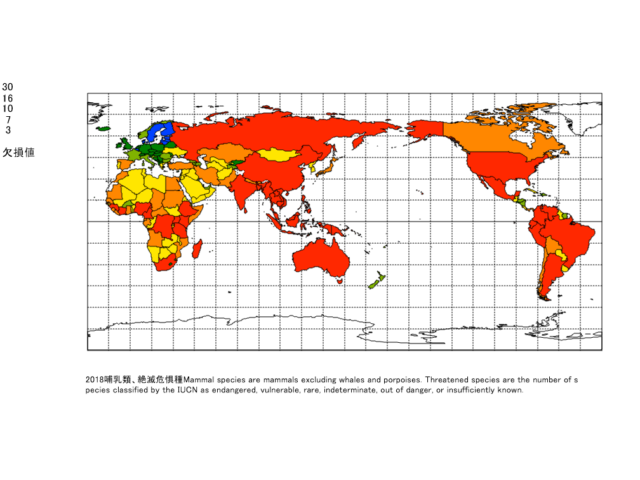
Title
Mammal species are mammals excluding whales and porpoises. Threatened species are the number of species classified by the IUCN as endangered, vulnerable, rare, indeterminate, out of danger, or insufficiently known.
Source
United Nations Environmental Program and the World Conservation Monitoring Centre, and International Union for Conservation of Nature, Red List of Threatened Species.
Google Earth
-
2021森林面積(平方km)
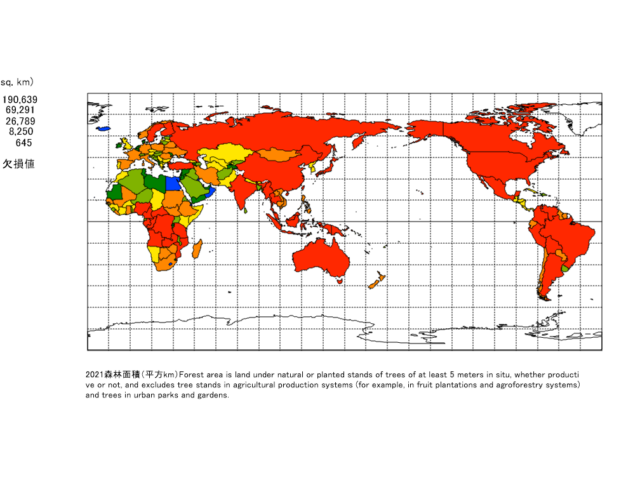
Title
Forest area is land under natural or planted stands of trees of at least 5 meters in situ, whether productive or not, and excludes tree stands in agricultural production systems (for example, in fruit plantations and agroforestry systems) and trees in urban parks and gardens.
Source
Food and Agriculture Organization, electronic files and web site.
Google Earth
-
2021森林賃料(対GDP比)
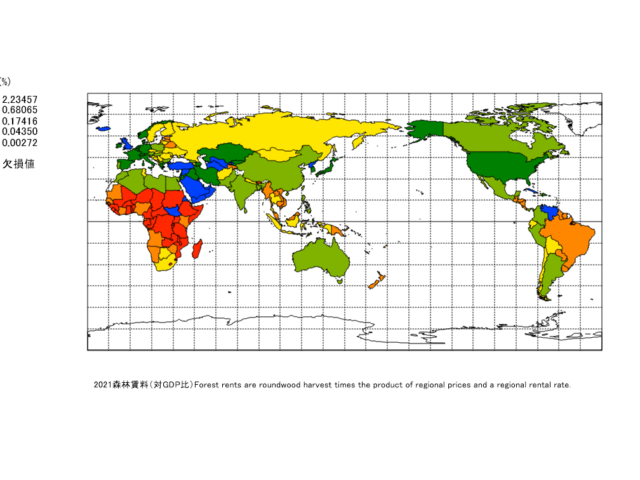
Title
Forest rents are roundwood harvest times the product of regional prices and a regional rental rate.
Source
World Bank staff estimates based on sources and methods described in the World Bank’s The Changing Wealth of Nations.
Google Earth
-
2021森林面積(国土に占める割合)
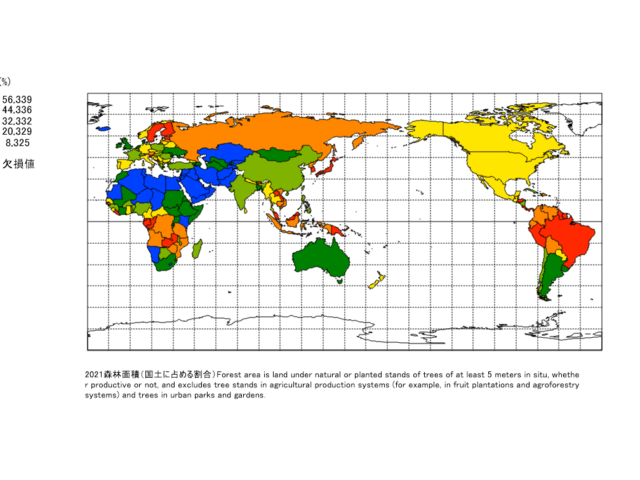
Title
Forest area is land under natural or planted stands of trees of at least 5 meters in situ, whether productive or not, and excludes tree stands in agricultural production systems (for example, in fruit plantations and agroforestry systems) and trees in urban parks and gardens.
Source
Food and Agriculture Organization, electronic files and web site.
Google Earth
-
2018魚類、絶滅危惧種
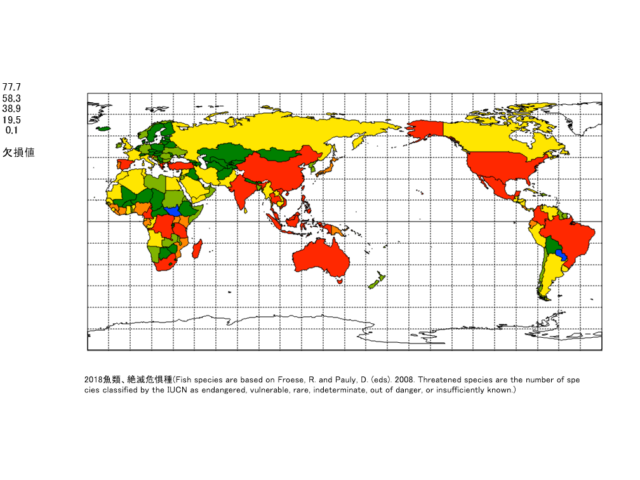
Title
(Fish species are based on Froese, R. and Pauly, D. (eds). 2008. Threatened species are the number of species classified by the IUCN as endangered, vulnerable, rare, indeterminate, out of danger, or insufficiently known.)
Source
Froese, R. and Pauly, D. (eds). 2008. FishBase database, www.fishbase.org.
Google Earth
-
2022工業プロセスからのFガス排出量(Mt-CO2e)
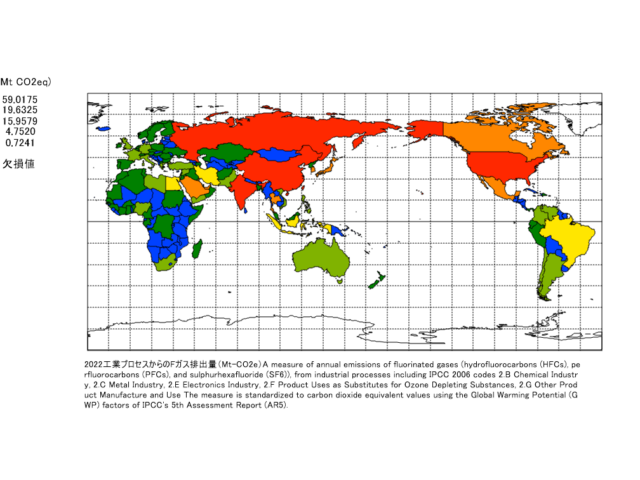
Title
A measure of annual emissions of fluorinated gases (hydrofluorocarbons (HFCs), perfluorocarbons (PFCs), and sulphurhexafluoride (SF6)), from industrial processes including IPCC 2006 codes 2.B Chemical Industry, 2.C Metal Industry, 2.E Electronics Industry, 2.F Product Uses as Substitutes for Ozone Depleting Substances, 2.G Other Product Manufacture and Use The measure is standardized to carbon dioxide equivalent values using the Global Warming Potential (GWP) factors of IPCC’s 5th Assessment Report (AR5).
Source
EDGAR (Emissions Database for Global Atmospheric Research) Community GHG Database, a collaboration between the European Commission, Joint Research Centre (JRC), the International Energy Agency (IEA), and comprising IEA-EDGAR CO2, EDGAR CH4, EDGAR N2O, EDGAR F-GASES version 8.0, (2023) European Commission, JRC (Datasets). https://edgar.jrc.ec.europa.eu/dataset_ghg80
Google Earth
-
2018鳥類、絶滅危惧種
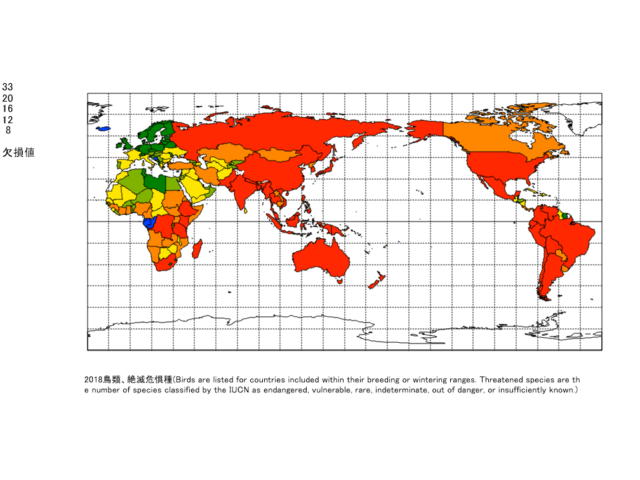
Title
(Birds are listed for countries included within their breeding or wintering ranges. Threatened species are the number of species classified by the IUCN as endangered, vulnerable, rare, indeterminate, out of danger, or insufficiently known.)
Source
United Nations Environmental Program and the World Conservation Monitoring Centre, and International Union for Conservation of Nature, Red List of Threatened Species.
Google Earth
-
2021調整後貯蓄:エネルギー枯渇(対GNI比)
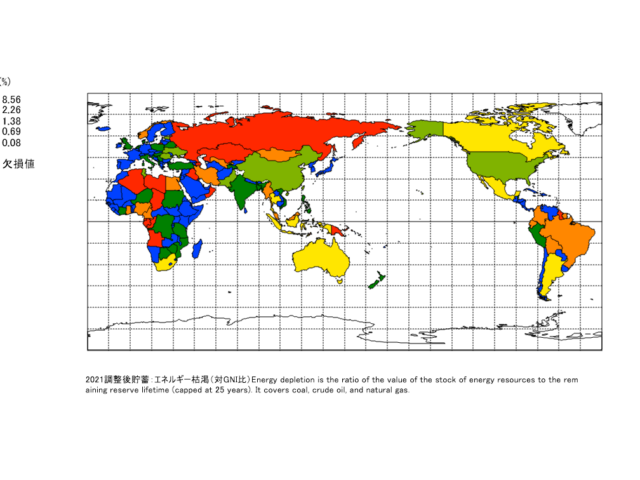
Title
Energy depletion is the ratio of the value of the stock of energy resources to the remaining reserve lifetime (capped at 25 years). It covers coal, crude oil, and natural gas.
Source
World Bank staff estimates based on sources and methods in World Bank’s “The Changing Wealth of Nations: Measuring Sustainable Development in the New Millennium” (2011).
Google Earth
-
2015代替エネルギーと原子力エネルギー(総エネルギー使用量に占める割合)
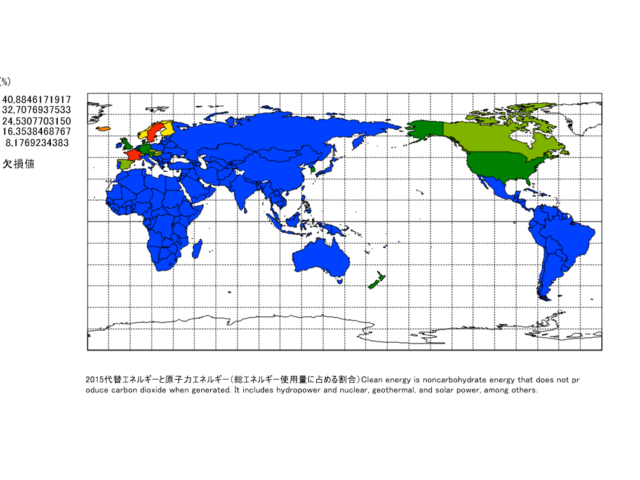
Title
Clean energy is noncarbohydrate energy that does not produce carbon dioxide when generated. It includes hydropower and nuclear, geothermal, and solar power, among others.
Source
IEA Statistics © OECD/IEA 2014 (https://www.iea.org/data-and-statistics), subject to https://www.iea.org/terms/
Google Earth
-
2021標準化降水量-蒸発散量指数
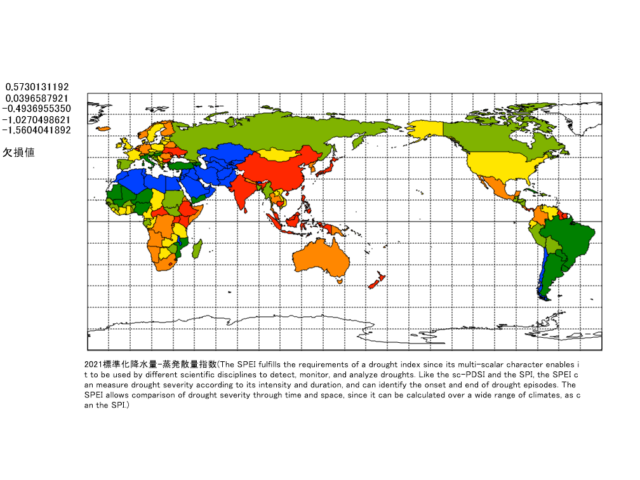
Title
(The SPEI fulfills the requirements of a drought index since its multi-scalar character enables it to be used by different scientific disciplines to detect, monitor, and analyze droughts. Like the sc-PDSI and the SPI, the SPEI can measure drought severity according to its intensity and duration, and can identify the onset and end of drought episodes. The SPEI allows comparison of drought severity through time and space, since it can be calculated over a wide range of climates, as can the SPI.)
Source
Global SPEI database (SPEIbase). https://spei.csic.es/database.html
Google Earth
-
2020環境水質が良好な水域の割合
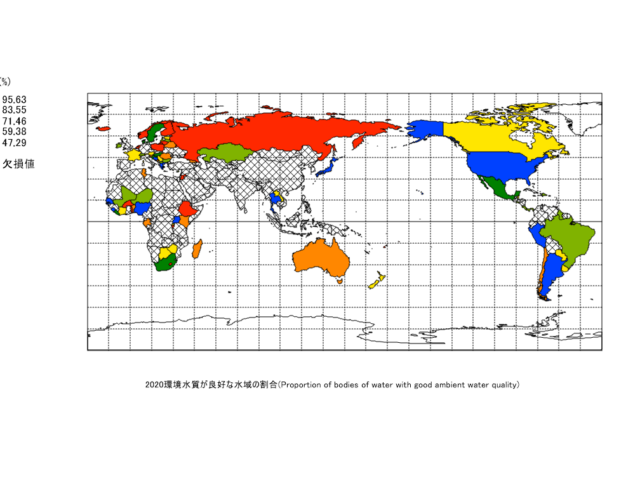
Title
(Proportion of bodies of water with good ambient water quality)
Source
UN Water. https://www.unwater.org/
Google Earth
-
2021樹木被覆損失(ヘクタール)
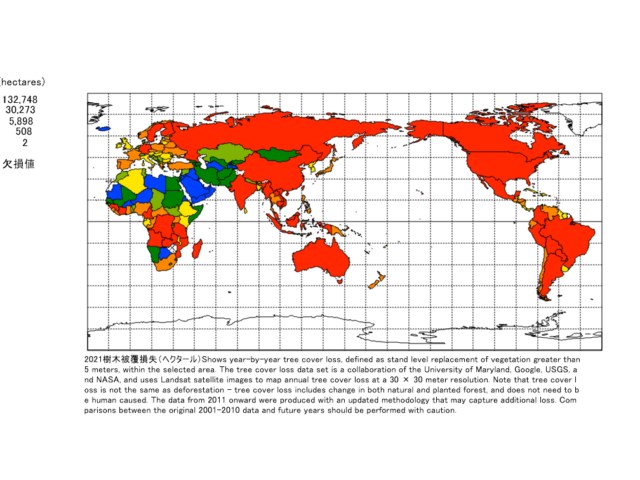
Title
Shows year-by-year tree cover loss, defined as stand level replacement of vegetation greater than 5 meters, within the selected area. The tree cover loss data set is a collaboration of the University of Maryland, Google, USGS, and NASA, and uses Landsat satellite images to map annual tree cover loss at a 30 × 30 meter resolution. Note that tree cover loss is not the same as deforestation ? tree cover loss includes change in both natural and planted forest, and does not need to be human caused. The data from 2011 onward were produced with an updated methodology that may capture additional loss. Comparisons between the original 2001-2010 data and future years should be performed with caution.
Source
Global Forest Watch. Tree Cover Loss (Hansen/UMD/Google/USGS/NASA).
Google Earth
-
2020再生可能エネルギー消費量(総最終エネルギー消費量に占める割合)
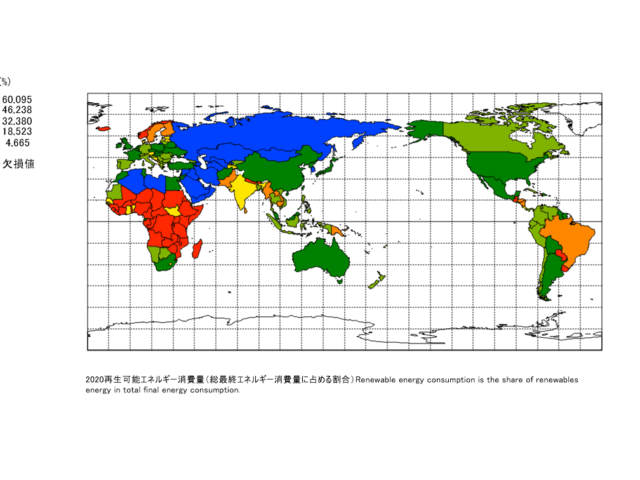
Title
Renewable energy consumption is the share of renewables energy in total final energy consumption.
Source
IEA, IRENA, UNSD, World Bank, WHO. 2023. Tracking SDG 7: The Energy Progress Report. World Bank, Washington DC. © World Bank. License: Creative Commons Attribution—NonCommercial 3.0 IGO (CC BY-NC 3.0 IGO).
Google Earth
-
2022陸域および海域の保護地域(総領土面積に占める割合)
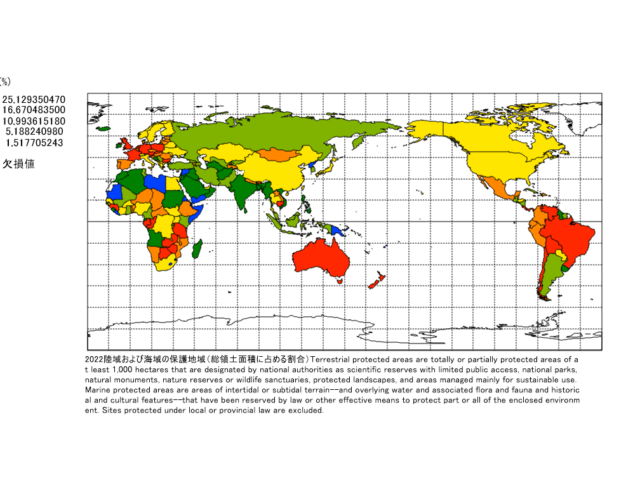
Title
Terrestrial protected areas are totally or partially protected areas of at least 1,000 hectares that are designated by national authorities as scientific reserves with limited public access, national parks, natural monuments, nature reserves or wildlife sanctuaries, protected landscapes, and areas managed mainly for sustainable use. Marine protected areas are areas of intertidal or subtidal terrain–and overlying water and associated flora and fauna and historical and cultural features–that have been reserved by law or other effective means to protect part or all of the enclosed environment. Sites protected under local or provincial law are excluded.
Source
World Database on Protected Areas (WDPA) where the compilation and management is carried out by United Nations Environment World Conservation Monitoring Centre (UNEP-WCMC) in collaboration with governments, non-governmental organizations, academia and industry. The data is available online through the Protected Planet website (https://www.protectedplanet.net/).
Google Earth
-
2020亜酸化窒素排出量(一人当たりCO2換算メートルトン)
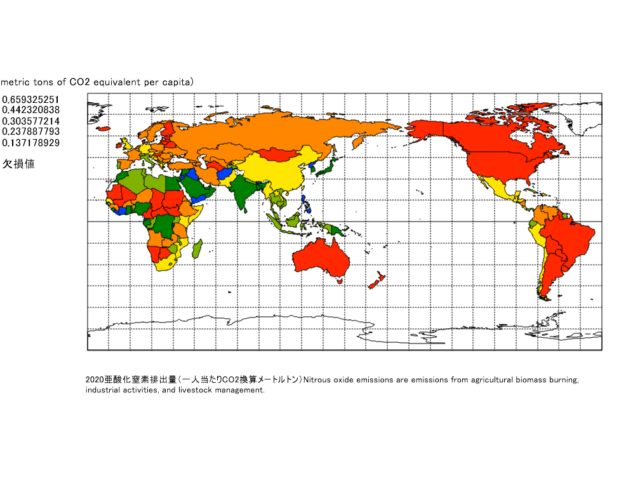
Title
Nitrous oxide emissions are emissions from agricultural biomass burning, industrial activities, and livestock management.
Source
Emissions data are sourced from Climate Watch Historical GHG Emissions (1990-2020). 2023. Washington, DC: World Resources Institute. Available online at: https://www.climatewatchdata.org/ghg-emissions
Google Earth
-
2021森林面積(国土に占める割合)
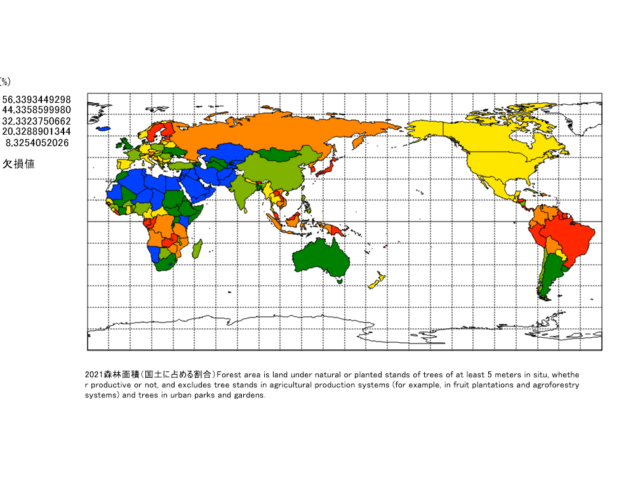
Title
Forest area is land under natural or planted stands of trees of at least 5 meters in situ, whether productive or not, and excludes tree stands in agricultural production systems (for example, in fruit plantations and agroforestry systems) and trees in urban parks and gardens.
Source
Food and Agriculture Organization, electronic files and web site.
Google Earth
-
2020メタン排出量(一人当たりCO2換算メートルトン)
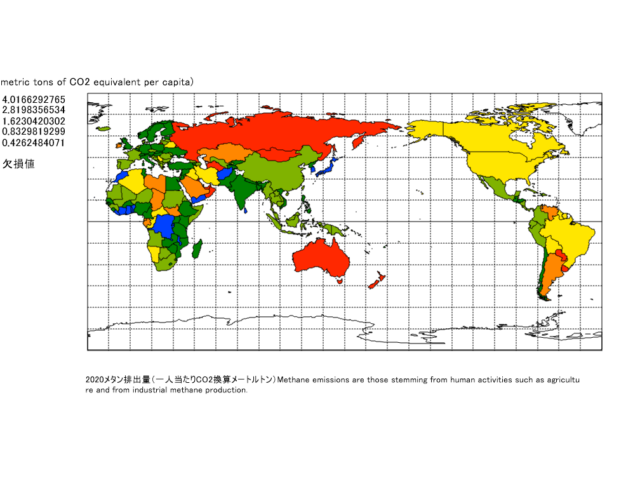
Title
Methane emissions are those stemming from human activities such as agriculture and from industrial methane production.
Source
Emissions data are sourced from Climate Watch Historical GHG Emissions (1990-2020). 2023. Washington, DC: World Resources Institute. Available online at: https://www.climatewatchdata.org/ghg-emissions
Google Earth
-
2020年CO2排出量(一人当たりメートルトン)
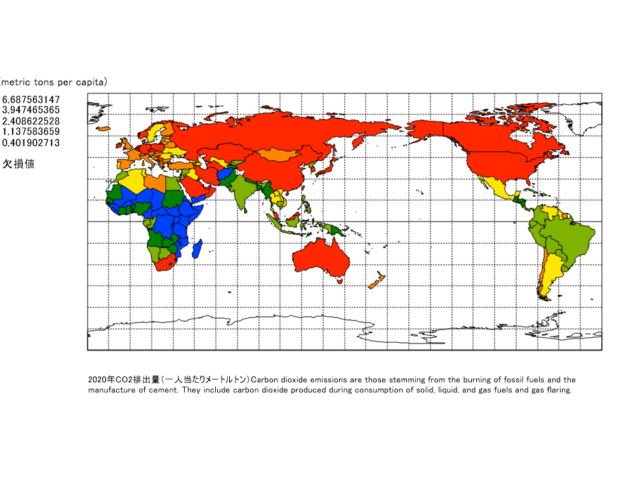
Title
Carbon dioxide emissions are those stemming from the burning of fossil fuels and the manufacture of cement. They include carbon dioxide produced during consumption of solid, liquid, and gas fuels and gas flaring.
Source
Emissions data are sourced from Climate Watch Historical GHG Emissions (1990-2020). 2023. Washington, DC: World Resources Institute. Available online at: https://www.climatewatchdata.org/ghg-emissions
Google Earth
-
2020海岸保護
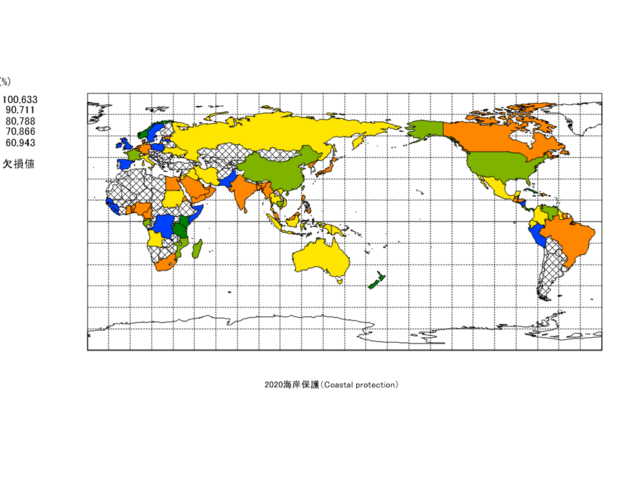
Title
Coastal protection
Source
Ocean Health Index. https://ohi-science.org/
Google Earth
-
2021調整後貯蓄:森林枯渇(GNI比)
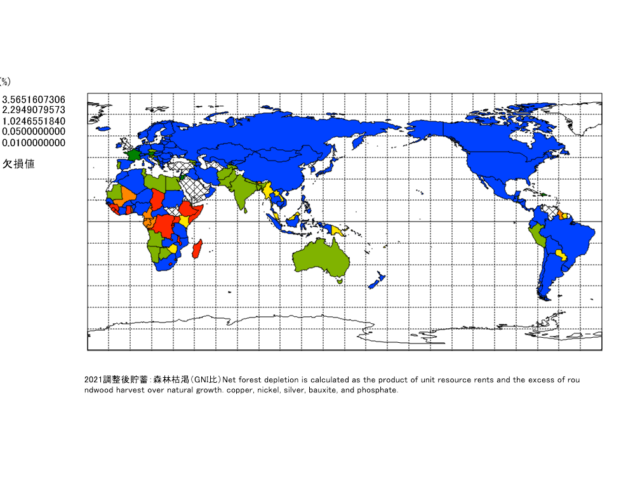
Title
Net forest depletion is calculated as the product of unit resource rents and the excess of roundwood harvest over natural growth. copper, nickel, silver, bauxite, and phosphate.
Source
World Bank staff estimates based on sources and methods in World Bank’s “The Changing Wealth of Nations: Measuring Sustainable Development in the New Millennium” (2011).
Google Earth
-
2021調整後貯蓄:天然資源枯渇(対GNI比)
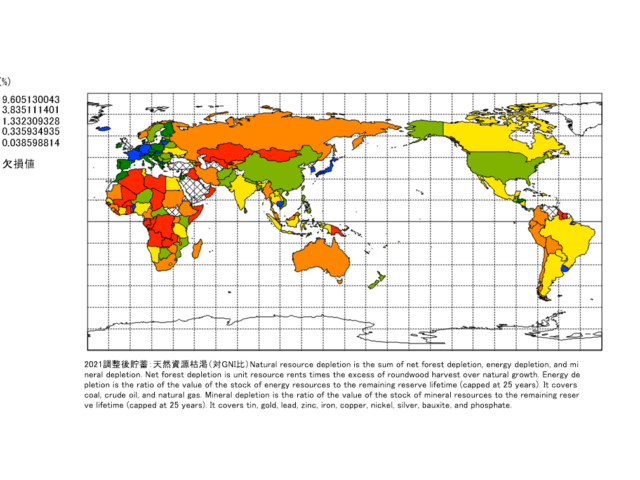
Title
Natural resource depletion is the sum of net forest depletion, energy depletion, and mineral depletion. Net forest depletion is unit resource rents times the excess of roundwood harvest over natural growth. Energy depletion is the ratio of the value of the stock of energy resources to the remaining reserve lifetime (capped at 25 years). It covers coal, crude oil, and natural gas. Mineral depletion is the ratio of the value of the stock of mineral resources to the remaining reserve lifetime (capped at 25 years). It covers tin, gold, lead, zinc, iron, copper, nickel, silver, bauxite, and phosphate.
Source
World Bank staff estimates based on sources and methods in World Bank’s “The Changing Wealth of Nations: Measuring Sustainable Development in the New Millennium” (2011).
Google Earth
食糧生産 Food Production
Mandara
-
2023年食料輸入(商品輸入に占める割合)
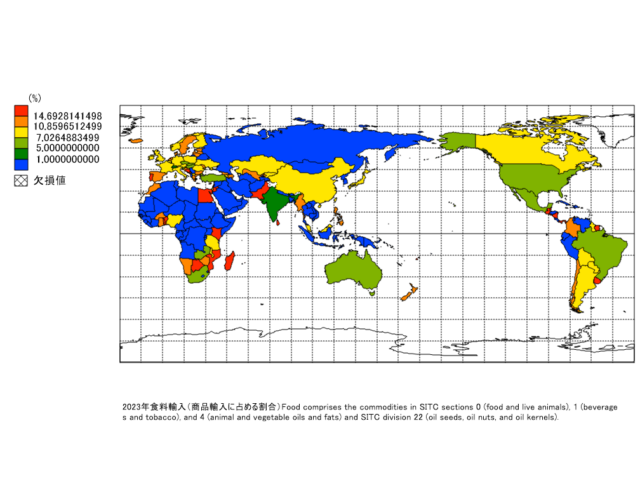
Title
Food comprises the commodities in SITC sections 0 (food and live animals), 1 (beverages and tobacco), and 4 (animal and vegetable oils and fats) and SITC division 22 (oil seeds, oil nuts, and oil kernels).
Source
World Bank staff estimates through the WITS platform from the Comtrade database maintained by the United Nations Statistics Division.
Google Earth
-
2023年食料輸出(商品輸出に占める割合)
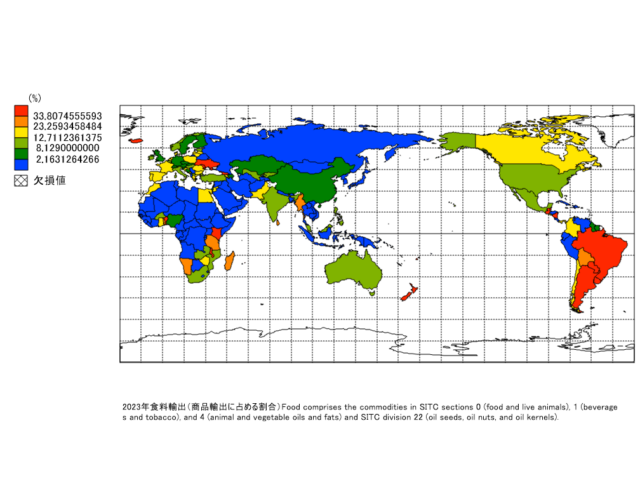
Title
Food comprises the commodities in SITC sections 0 (food and live animals), 1 (beverages and tobacco), and 4 (animal and vegetable oils and fats) and SITC division 22 (oil seeds, oil nuts, and oil kernels).
Source
World Bank staff estimates through the WITS platform from the Comtrade database maintained by the United Nations Statistics Division.
Google Earth
-
2021年農業による年間淡水取水量(全淡水取水量に占める割合)
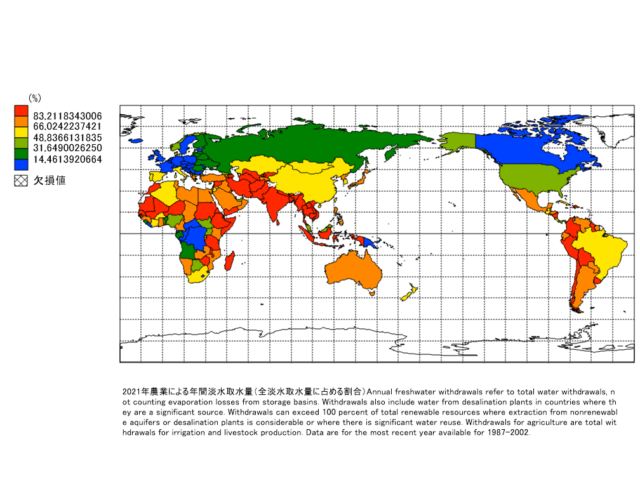
Title
Annual freshwater withdrawals refer to total water withdrawals, not counting evaporation losses from storage basins. Withdrawals also include water from desalination plants in countries where they are a significant source. Withdrawals can exceed 100 percent of total renewable resources where extraction from nonrenewable aquifers or desalination plants is considerable or where there is significant water reuse. Withdrawals for agriculture are total withdrawals for irrigation and livestock production. Data are for the most recent year available for 1987-2002.
Source
Food and Agriculture Organization, AQUASTAT data.
Google Earth
-
2022年食品、飲料、タバコ(製造業付加価値額の割合)
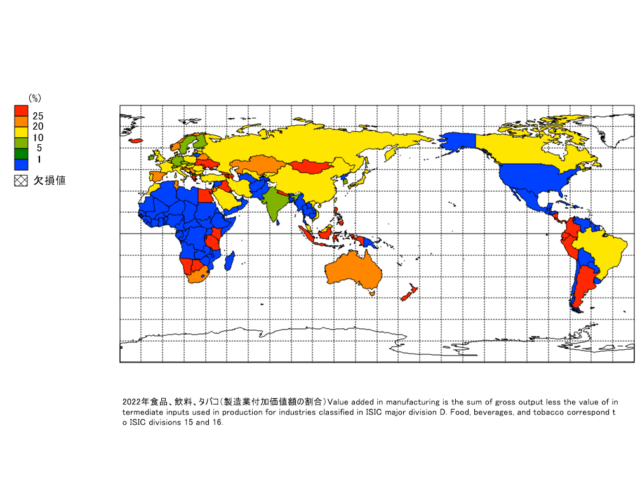
Title
Value added in manufacturing is the sum of gross output less the value of intermediate inputs used in production for industries classified in ISIC major division D. Food, beverages, and tobacco correspond to ISIC divisions 15 and 16.
Source
United Nations Industrial Development Organization, International Yearbook of Industrial Statistics.
Google Earth
-
2020年水の生産性合計(2015年の恒常的な米ドルによるGDPの淡水総取水量1立方メートル当たり)
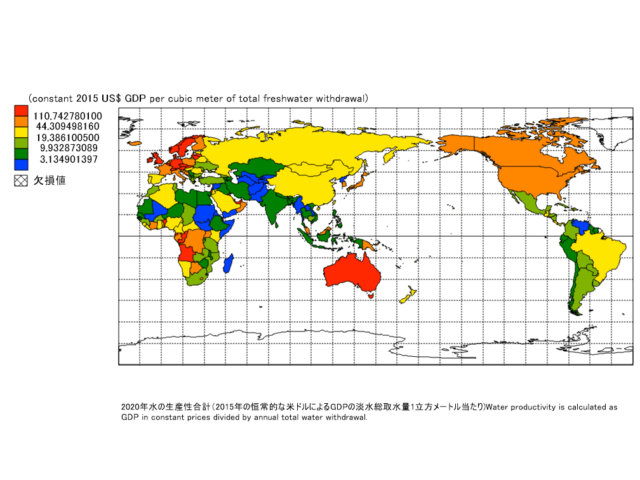
Title
Water productivity is calculated as GDP in constant prices divided by annual total water withdrawal.
Source
Food and Agriculture Organization, AQUASTAT data, and World Bank and OECD GDP estimates.
Google Earth
-
2021年永続的耕作地(土地面積に占める割合)
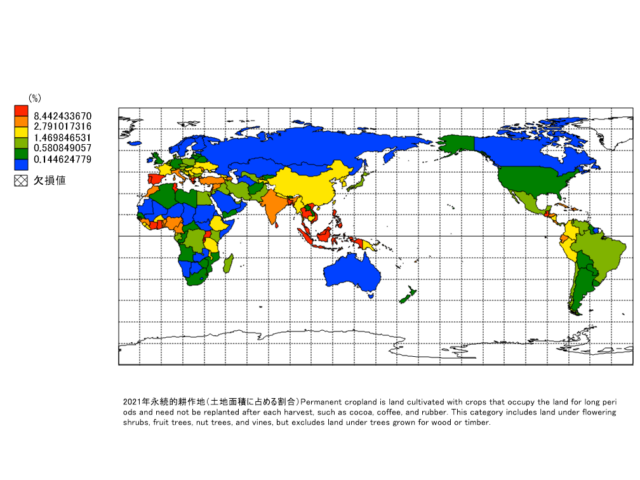
Title
Permanent cropland is land cultivated with crops that occupy the land for long periods and need not be replanted after each harvest, such as cocoa, coffee, and rubber. This category includes land under flowering shrubs, fruit trees, nut trees, and vines, but excludes land under trees grown for wood or timber.
Source
Food and Agriculture Organization, electronic files and web site.
Google Earth
-
2022年総漁業生産量(メートルトン)
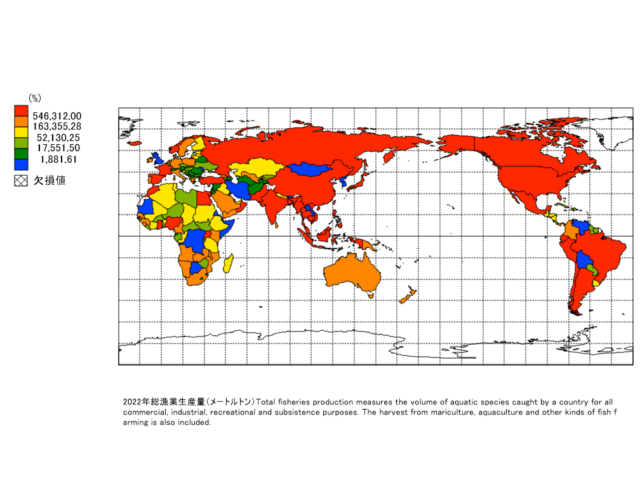
Title
Total fisheries production measures the volume of aquatic species caught by a country for all commercial, industrial, recreational and subsistence purposes. The harvest from mariculture, aquaculture and other kinds of fish farming is also included.
Source
Food and Agriculture Organization.
Google Earth
-
2021年肥料消費量(耕地1ヘクタール当たりキログラム)
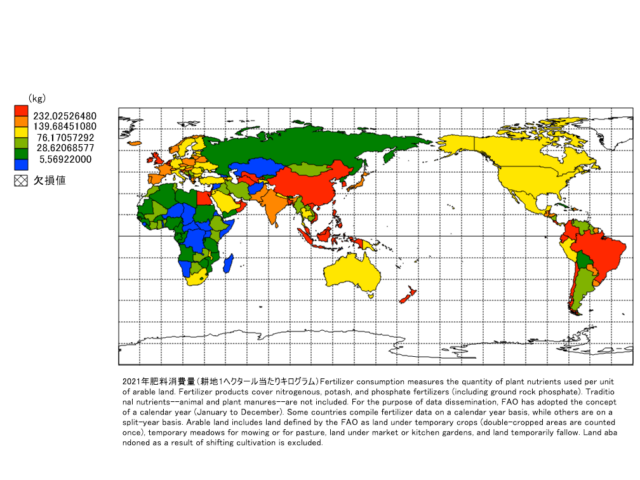
Title
Fertilizer consumption measures the quantity of plant nutrients used per unit of arable land. Fertilizer products cover nitrogenous, potash, and phosphate fertilizers (including ground rock phosphate). Traditional nutrients–animal and plant manures–are not included. For the purpose of data dissemination, FAO has adopted the concept of a calendar year (January to December). Some countries compile fertilizer data on a calendar year basis, while others are on a split-year basis. Arable land includes land defined by the FAO as land under temporary crops (double-cropped areas are counted once), temporary meadows for mowing or for pasture, land under market or kitchen gardens, and land temporarily fallow. Land abandoned as a result of shifting cultivation is excluded.
Source
Food and Agriculture Organization, electronic files and web site.
Google Earth
-
2022年農作物生産指数(2014~2016年=100)
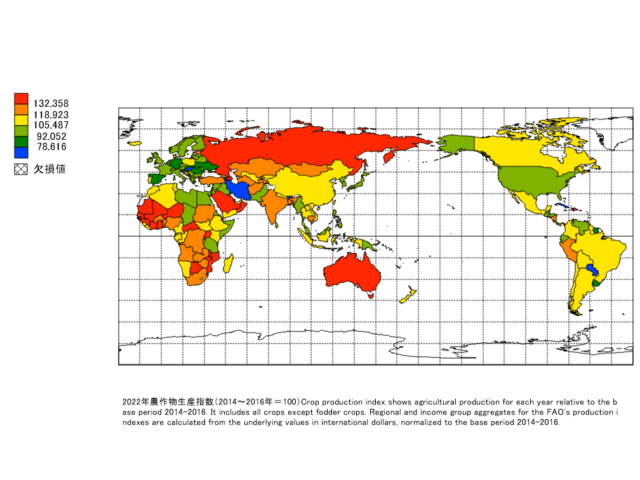
Title
Crop production index shows agricultural production for each year relative to the base period 2014-2016. It includes all crops except fodder crops. Regional and income group aggregates for the FAO’s production indexes are calculated from the underlying values in international dollars, normalized to the base period 2014-2016.
Source
Food and Agriculture Organization, electronic files and web site.
Google Earth
-
2021年肥料消費量(肥料生産量に対する割合)
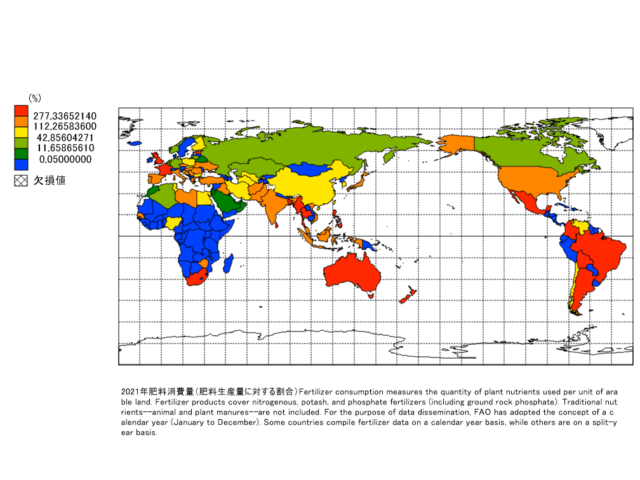
Title
Fertilizer consumption measures the quantity of plant nutrients used per unit of arable land. Fertilizer products cover nitrogenous, potash, and phosphate fertilizers (including ground rock phosphate). Traditional nutrients–animal and plant manures–are not included. For the purpose of data dissemination, FAO has adopted the concept of a calendar year (January to December). Some countries compile fertilizer data on a calendar year basis, while others are on a split-year basis.
Source
Food and Agriculture Organization, electronic files and web site.
Google Earth
-
2022年穀物収量(1ヘクタール当たりkg)
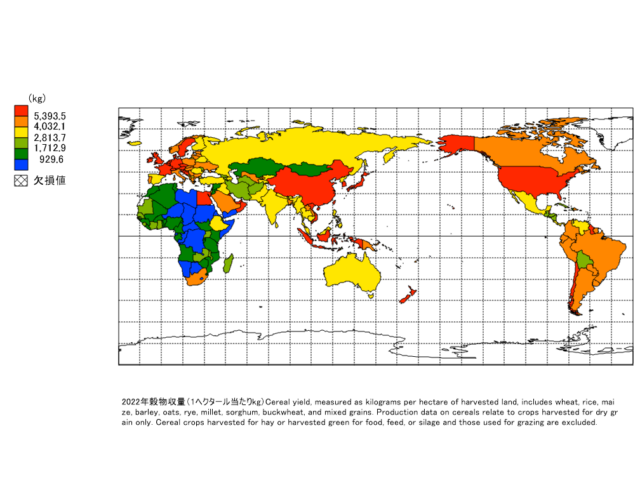
Title
Cereal yield, measured as kilograms per hectare of harvested land, includes wheat, rice, maize, barley, oats, rye, millet, sorghum, buckwheat, and mixed grains. Production data on cereals relate to crops harvested for dry grain only. Cereal crops harvested for hay or harvested green for food, feed, or silage and those used for grazing are excluded.
Source
Food and Agriculture Organization, electronic files and web site.
Google Earth
-
2022年畜産生産指数(2014~2016年=100)
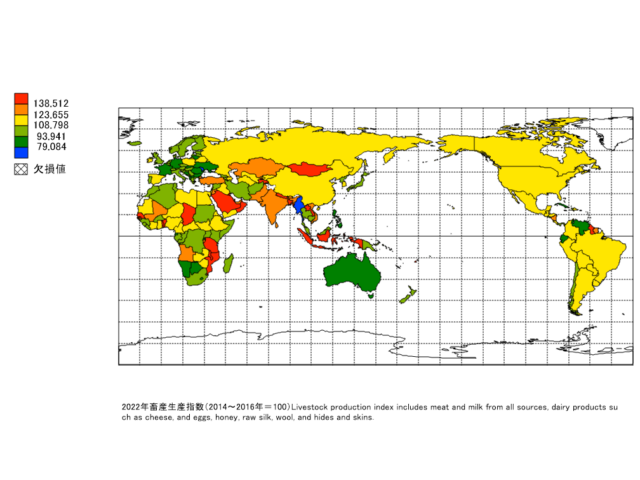
Title
Livestock production index includes meat and milk from all sources, dairy products such as cheese, and eggs, honey, raw silk, wool, and hides and skins.
Source
Food and Agriculture Organization, electronic files and web site.
Google Earth
-
2022年穀物生産量(メートルトン)
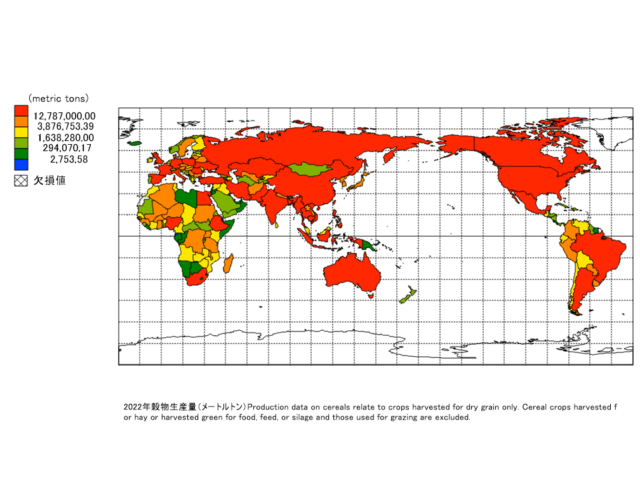
Title
Production data on cereals relate to crops harvested for dry grain only. Cereal crops harvested for hay or harvested green for food, feed, or silage and those used for grazing are excluded.
Source
Food and Agriculture Organization, electronic files and web site.
Google Earth
-
2021年耕地面積(1人当たりヘクタール)
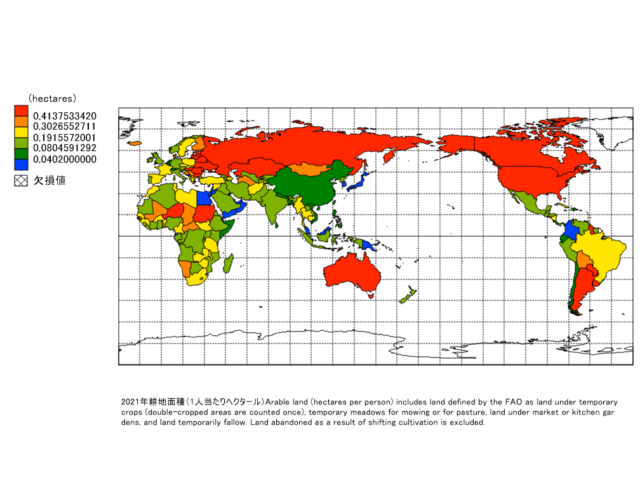
Title
Arable land (hectares per person) includes land defined by the FAO as land under temporary crops (double-cropped areas are counted once), temporary meadows for mowing or for pasture, land under market or kitchen gardens, and land temporarily fallow. Land abandoned as a result of shifting cultivation is excluded.
Source
Food and Agriculture Organization, electronic files and web site.
Google Earth
-
2022年捕獲漁業生産量(メートルトン)
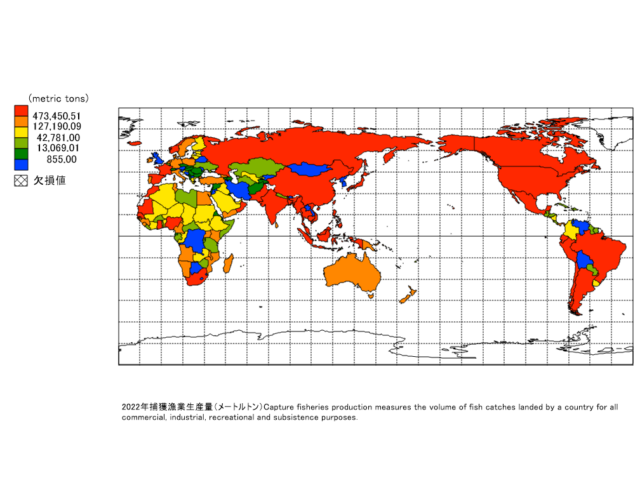
Title
Capture fisheries production measures the volume of fish catches landed by a country for all commercial, industrial, recreational and subsistence purposes.
Source
Food and Agriculture Organization, electronic files and web site.
Google Earth
-
2021年耕作地(土地面積に占める割合)
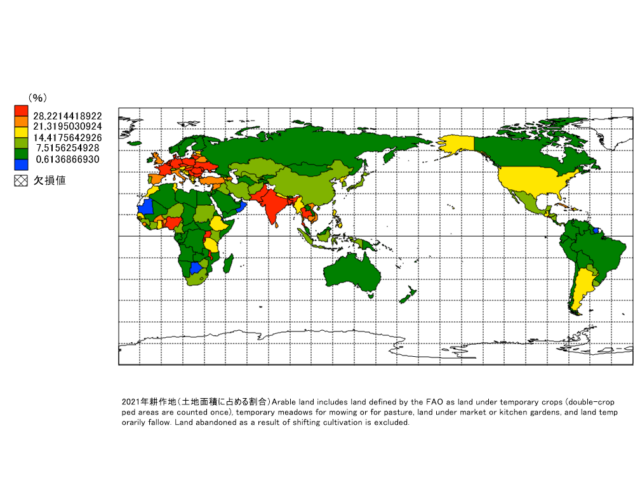
Title
Arable land includes land defined by the FAO as land under temporary crops (double-cropped areas are counted once), temporary meadows for mowing or for pasture, land under market or kitchen gardens, and land temporarily fallow. Land abandoned as a result of shifting cultivation is excluded.
Source
Food and Agriculture Organization, electronic files and web site.
Google Earth
-
2023年農林水産業付加価値額(年間成長率)
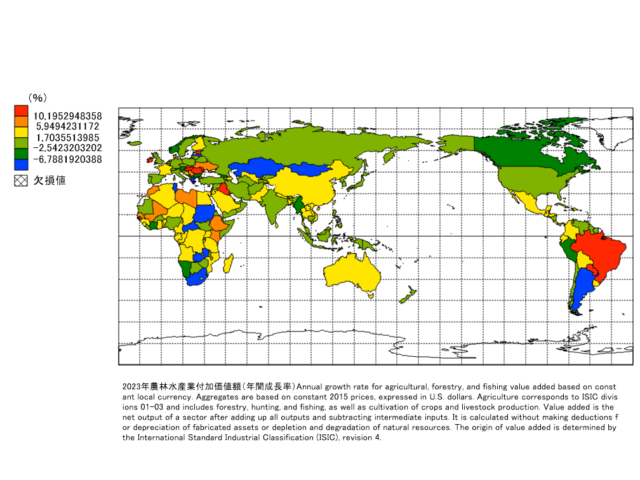
Title
Annual growth rate for agricultural, forestry, and fishing value added based on constant local currency. Aggregates are based on constant 2015 prices, expressed in U.S. dollars. Agriculture corresponds to ISIC divisions 01-03 and includes forestry, hunting, and fishing, as well as cultivation of crops and livestock production. Value added is the net output of a sector after adding up all outputs and subtracting intermediate inputs. It is calculated without making deductions for depreciation of fabricated assets or depletion and degradation of natural resources. The origin of value added is determined by the International Standard Industrial Classification (ISIC), revision 4.
Source
World Bank national accounts data, and OECD National Accounts data files.
Google Earth
-
2022年水産養殖生産量(メートルトン)
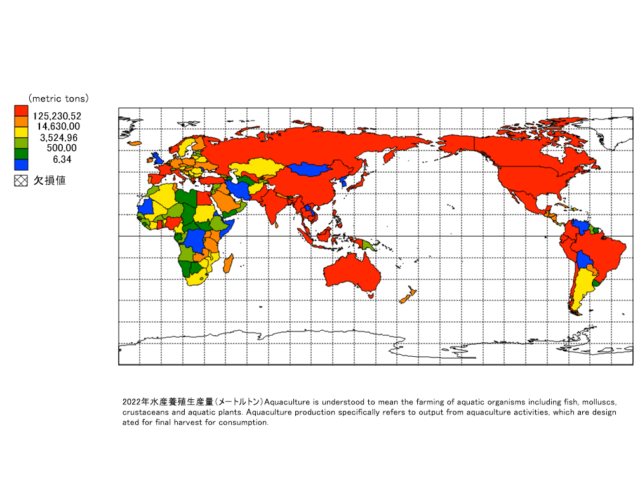
Title
Aquaculture is understood to mean the farming of aquatic organisms including fish, molluscs, crustaceans and aquatic plants. Aquaculture production specifically refers to output from aquaculture activities, which are designated for final harvest for consumption.
Source
Food and Agriculture Organization.
Google Earth
-
2023年農業原材料輸出(商品輸出に占める割合)
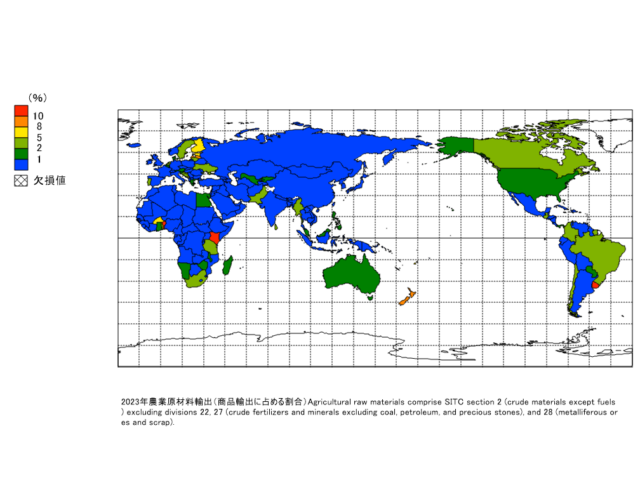
Title
Agricultural raw materials comprise SITC section 2 (crude materials except fuels) excluding divisions 22, 27 (crude fertilizers and minerals excluding coal, petroleum, and precious stones), and 28 (metalliferous ores and scrap).
Source
World Bank staff estimates through the WITS platform from the Comtrade database maintained by the United Nations Statistics Division.
Google Earth
-
2023年農業原料輸入(商品輸出に占める割合)
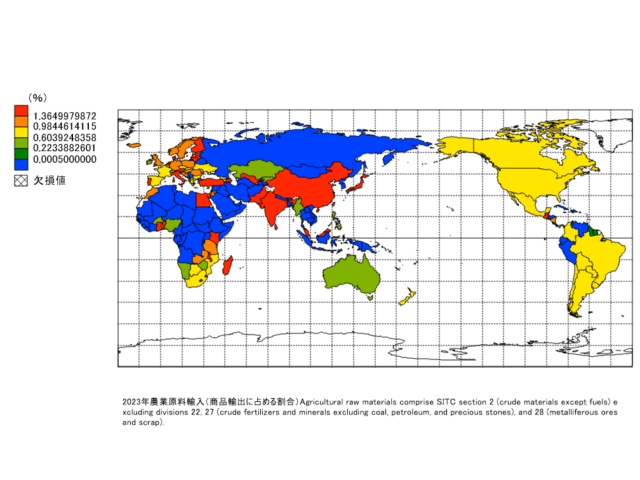
Title
Agricultural raw materials comprise SITC section 2 (crude materials except fuels) excluding divisions 22, 27 (crude fertilizers and minerals excluding coal, petroleum, and precious stones), and 28 (metalliferous ores and scrap).
Source
World Bank staff estimates through the WITS platform from the Comtrade database maintained by the United Nations Statistics Division.
Google Earth
-
2021年農業灌漑地(全農地に占める割合)
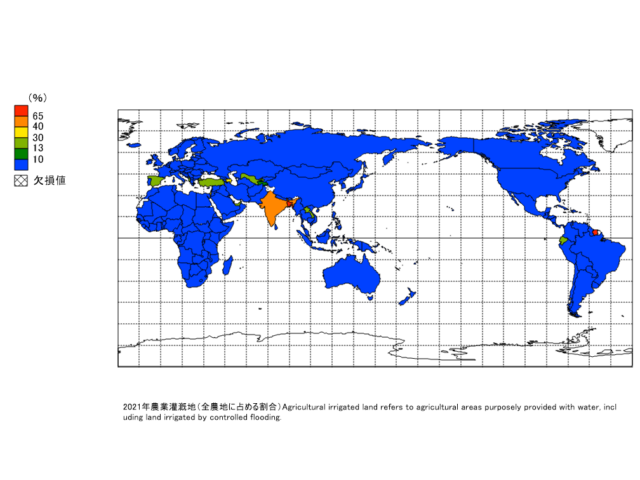
Title
Agricultural irrigated land refers to agricultural areas purposely provided with water, including land irrigated by controlled flooding.
Source
The data are collected by the Food and Agriculture Organization of the United Nations (FAO) from official national sources through annual questionnaires and are supplemented with information from official secondary data sources. The secondary sources cover official country data from websites of national ministries, national publications and related country data reported by various international organizations.. The FAO tries to impose standard definitions and reporting methods, but complete consistency across countries and over time is not possible. Thus, data on agricultural land in different climates may not be comparable. For example, permanent pastures are quite different in nature and intensity in African countries and dry Middle Eastern countries.
Google Earth
-
2022年農林水産業の付加価値
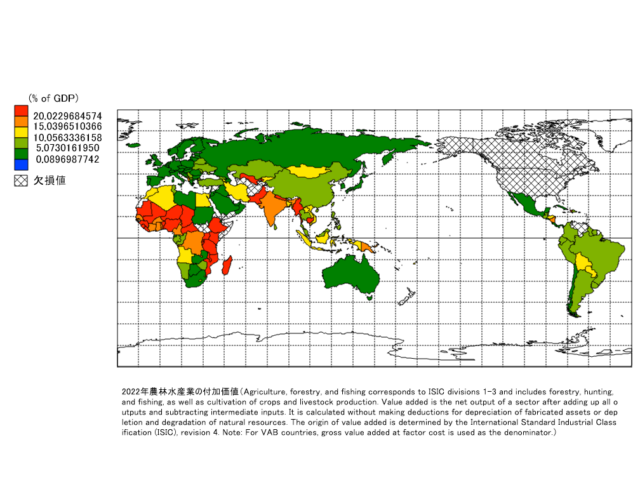
Title
Agriculture, forestry, and fishing corresponds to ISIC divisions 1-3 and includes forestry, hunting, and fishing, as well as cultivation of crops and livestock production. Value added is the net output of a sector after adding up all outputs and subtracting intermediate inputs. It is calculated without making deductions for depreciation of fabricated assets or depletion and degradation of natural resources. The origin of value added is determined by the International Standard Industrial Classification (ISIC), revision 4. Note: For VAB countries, gross value added at factor cost is used as the denominator.)
Source
World Bank national accounts data, and OECD National Accounts data files.
Google Earth
-
2022年食料生産指数(2014~2016年=100)
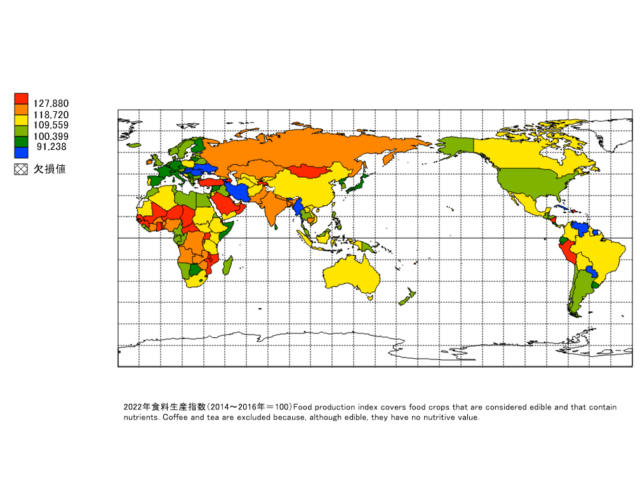
Title
Food production index covers food crops that are considered edible and that contain nutrients. Coffee and tea are excluded because, although edible, they have no nutritive value.
Source
Food and Agriculture Organization, electronic files and web site.
Google Earth
-
2021年農地(土地面積に占める割合)
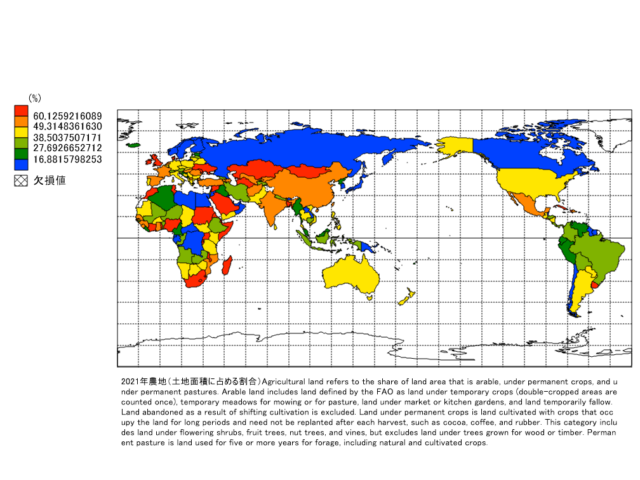
Title
Agricultural land refers to the share of land area that is arable, under permanent crops, and under permanent pastures. Arable land includes land defined by the FAO as land under temporary crops (double-cropped areas are counted once), temporary meadows for mowing or for pasture, land under market or kitchen gardens, and land temporarily fallow. Land abandoned as a result of shifting cultivation is excluded. Land under permanent crops is land cultivated with crops that occupy the land for long periods and need not be replanted after each harvest, such as cocoa, coffee, and rubber. This category includes land under flowering shrubs, fruit trees, nut trees, and vines, but excludes land under trees grown for wood or timber. Permanent pasture is land used for five or more years for forage, including natural and cultivated crops.
Source
Food and Agriculture Organization, electronic files and web site.
Google Earth
人口・健康 Population / Health
人口 Population
Mandara
-
2024年都市人口が総人口に占める比率
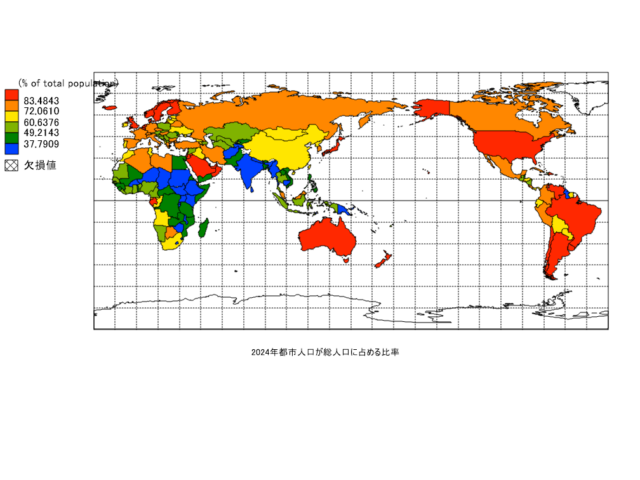
Title
Ratio of urban population to total population in 2024
Source
Data source: National Institute of Statistics and Censuses, United Nations World Population Prospects
Google Earth
-
2022年出生時の男女比
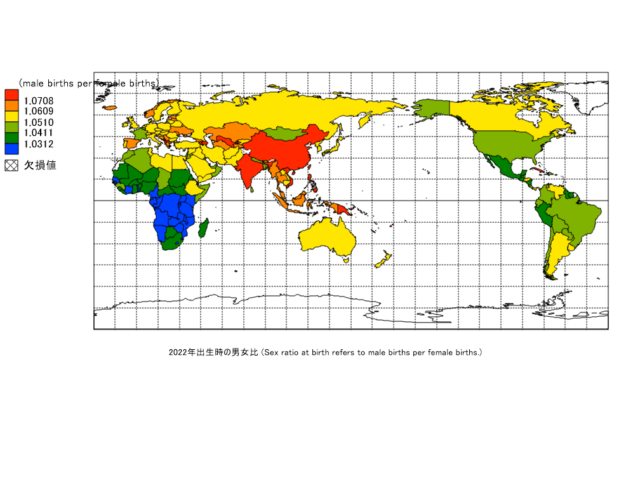
Title
Sex ratio at birth refers to male births per female births.
Source
Data source: National Institute of Statistics and Censuses, United Nations World Population Prospects
Google Earth
-
2024年農村人口が総人口に占める比率
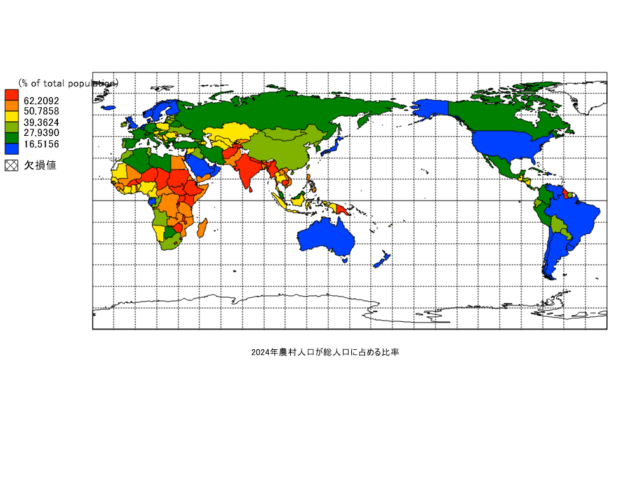
Title
Ratio of rural population to total population in 2024
Source
Data source: National Institute of Statistics and Censuses, United Nations World Population Prospects
Google Earth
-
2024年農村人口
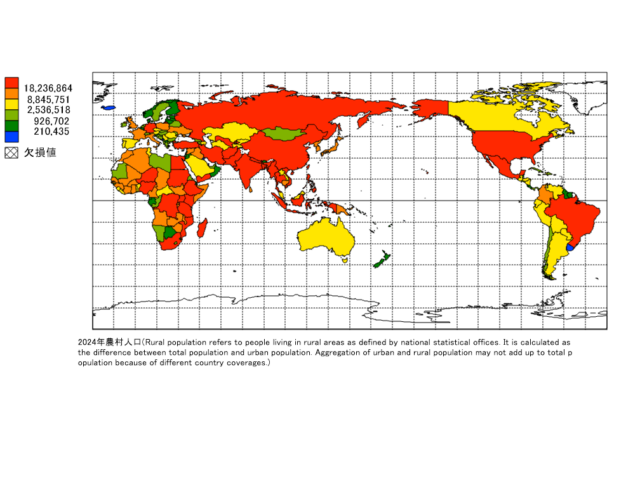
Title
Rural population refers to people living in rural areas as defined by national statistical offices. It is calculated as the difference between total population and urban population. Aggregation of urban and rural population may not add up to total population because of different country coverages.
Source
Data source: National Institute of Statistics and Censuses, United Nations World Population Prospects
Google Earth
-
2024年都市人口
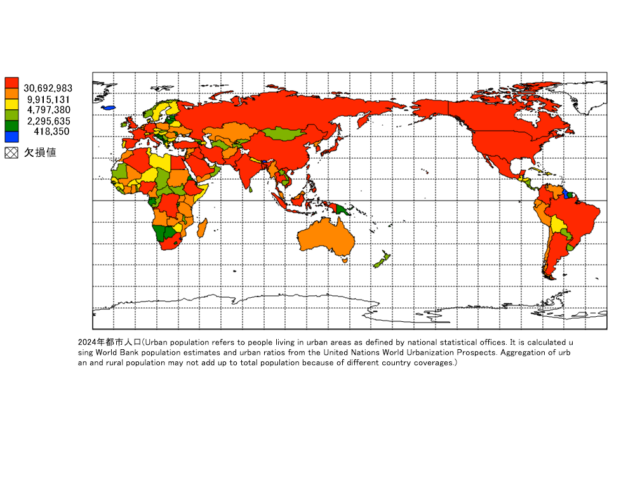
Title
Urban population refers to people living in urban areas as defined by national statistical offices. It is calculated using World Bank population estimates and urban ratios from the United Nations World Urbanization Prospects. Aggregation of urban and rural population may not add up to total population because of different country coverages
Source
Data source: National Institute of Statistics and Censuses, United Nations World Population Prospects
Google Earth
-
2024年総人口
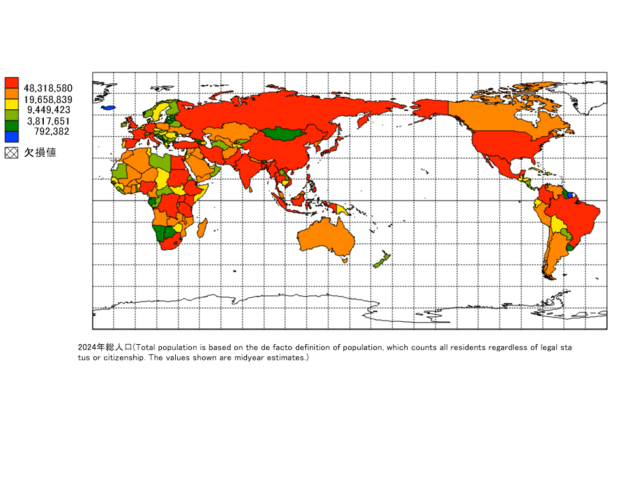
Title
Total population is based on the de facto definition of population, which counts all residents regardless of legal status or citizenship. The values shown are midyear estimates.
Source
Data source: National Institute of Statistics and Censuses, United Nations World Population Prospects
Google Earth
-
2022年合計特殊出生率
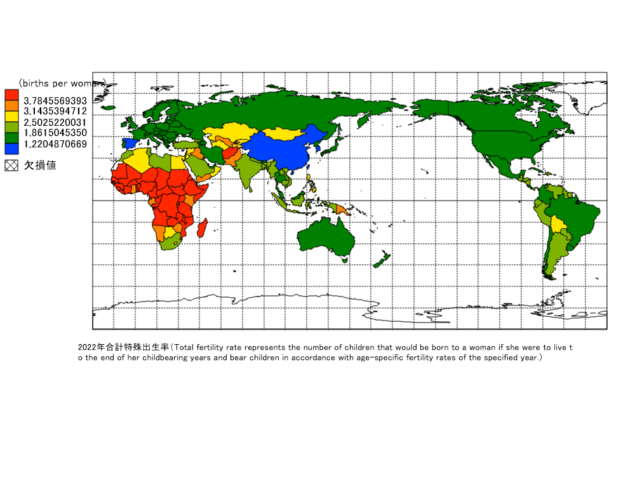
Title
Total fertility rate represents the number of children that would be born to a woman if she were to live to the end of her childbearing years and bear children in accordance with age-specific fertility rates of the specified year.
Source
Data source: National Institute of Statistics and Censuses, United Nations World Population Prospects
Google Earth
-
2022年人口増加率
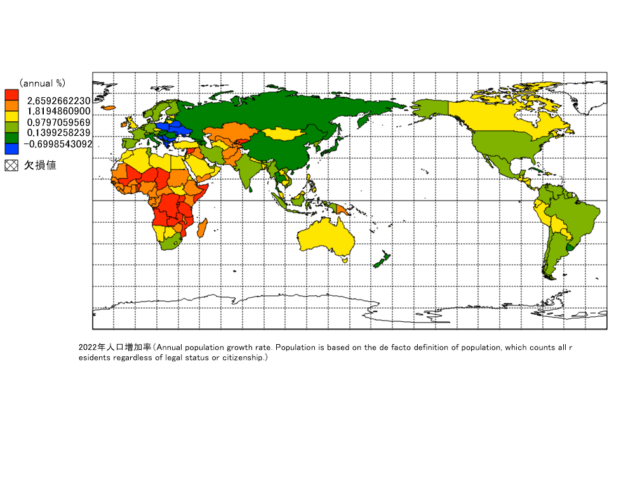
Title
Annual population growth rate. Population is based on the de facto definition of population, which counts all residents regardless of legal status or citizenship.
Source
Data source: National Institute of Statistics and Censuses, United Nations World Population Prospects
Google Earth
-
2022年自然増減率(出生率と死亡率の差)
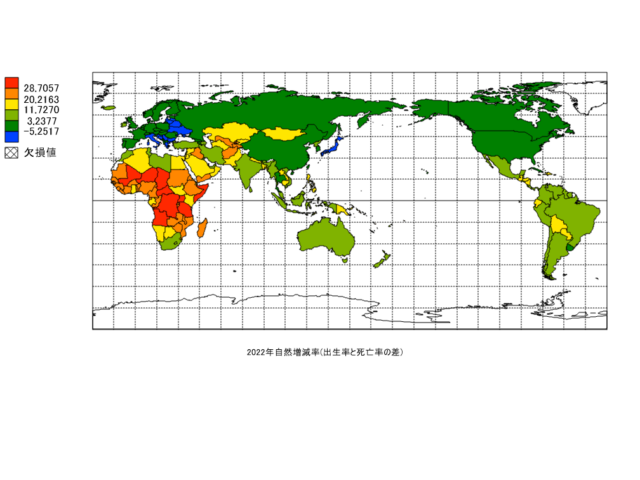
Title
Natural increase/decrease rate in 2022 (difference between birth rate and death rate)
Source
Data source: National Institute of Statistics and Censuses, United Nations World Population Prospects
Google Earth
-
2024年年齢別扶養比率
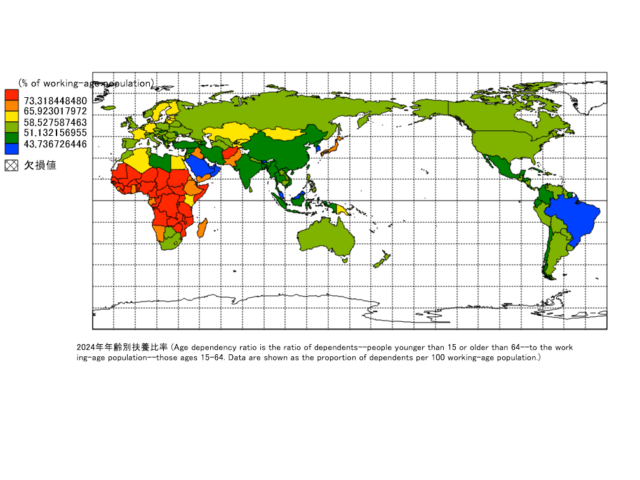
Title
Age dependency ratio is the ratio of dependents–people younger than 15 or older than 64–to the working-age population–those ages 15-64. Data are shown as the proportion of dependents per 100 working-age population.
Source
Data source: National Institute of Statistics and Censuses, United Nations World Population Prospects
Google Earth
-
2022年死亡率
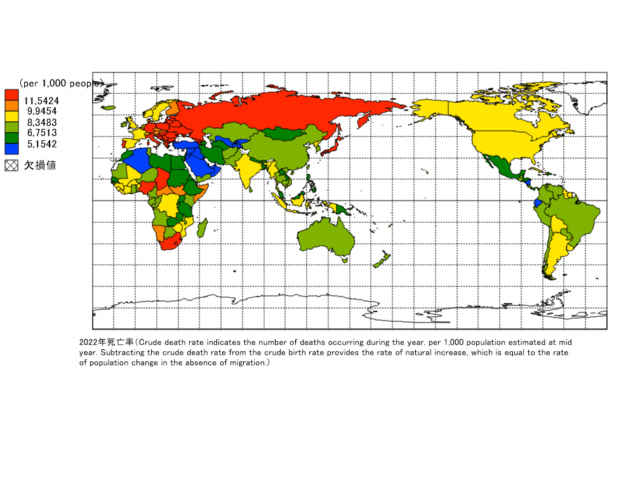
Title
Crude death rate indicates the number of deaths occurring during the year, per 1,000 population estimated at midyear. Subtracting the crude death rate from the crude birth rate provides the rate of natural increase, which is equal to the rate of population change in the absence of migration.
Source
Data source: National Institute of Statistics and Censuses, United Nations World Population Prospects
Google Earth
-
2022年出生率
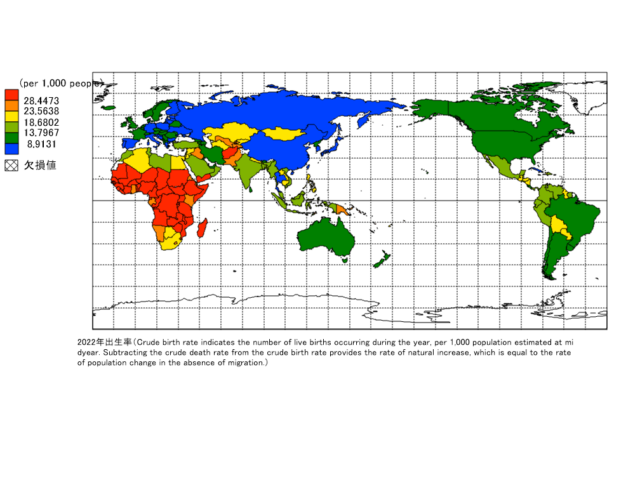
Title
Crude birth rate indicates the number of live births occurring during the year, per 1,000 population estimated at midyear. Subtracting the crude death rate from the crude birth rate provides the rate of natural increase, which is equal to the rate of population change in the absence of migration.
Source
Data source: National Institute of Statistics and Censuses, United Nations World Population Prospects
Google Earth
-
死亡数
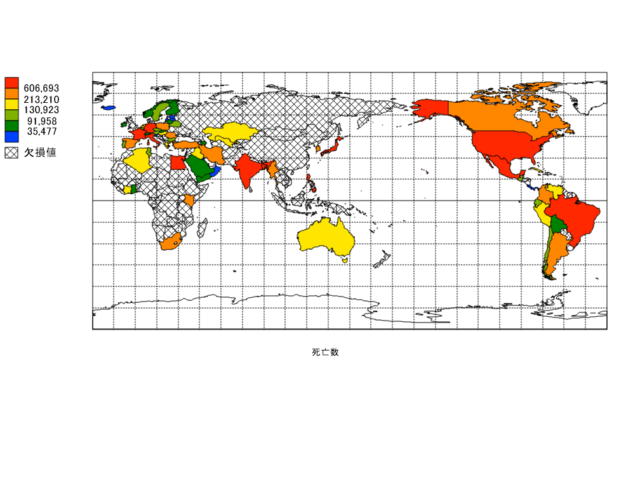
Title
Number of deaths
Source
UN, Demographic Yearbook System, Demographic Yearbook 2022. UN, World Population Prospects:The 2022 Revision
Google Earth
-
2021年人口密度
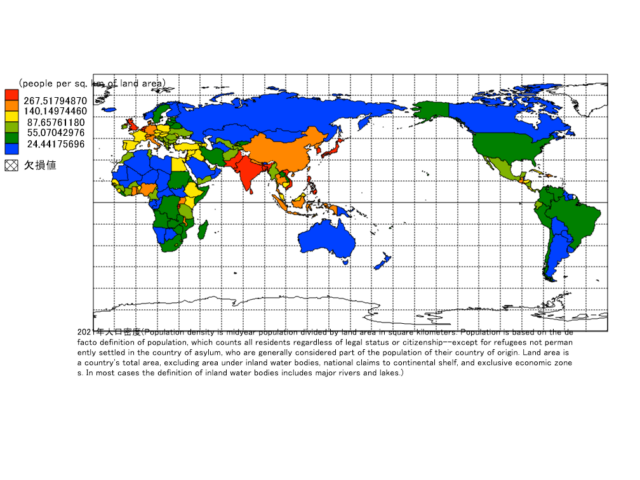
Title
Population density is midyear population divided by land area in square kilometers. Population is based on the de facto definition of population, which counts all residents regardless of legal status or citizenship–except for refugees not permanently settled in the country of asylum, who are generally considered part of the population of their country of origin. Land area is a country’s total area, excluding area under inland water bodies, national claims to continental shelf, and exclusive economic zones. In most cases the definition of inland water bodies includes major rivers and lakes.
Source
Food and Agriculture Organization and World Bank population estimates.
Google Earth
-
出生数
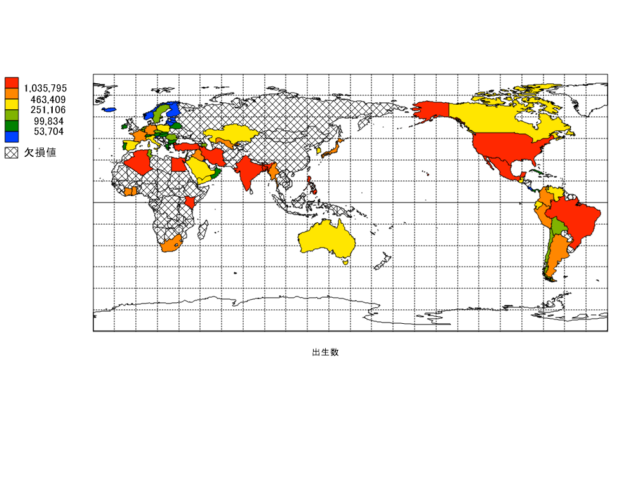
Title
Number of births
Source
UN, Demographic Yearbook System, Demographic Yearbook 2022. UN, World Population Prospects:The 2022 Revision
Google Earth
-
純移動
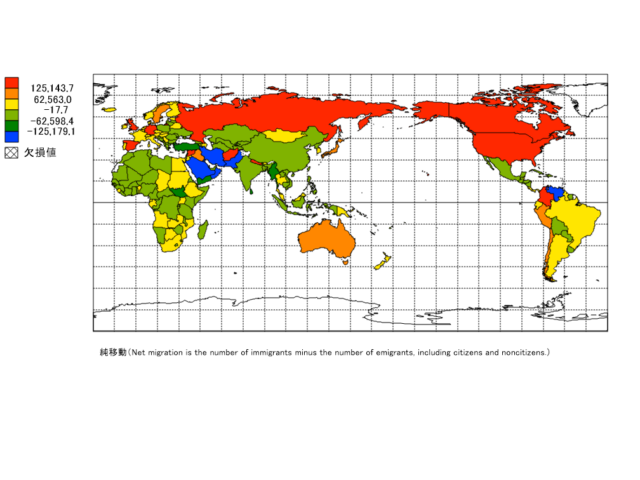
Title
Net migration is the number of immigrants minus the number of emigrants, including citizens and noncitizens.
Source
United Nations Population Division. World Population Prospects: 2022 Revision.
Google Earth
公衆衛生 Public Health
Mandara
-
2022年外科医療費が貧困化するリスク(リスクがある人の割合)
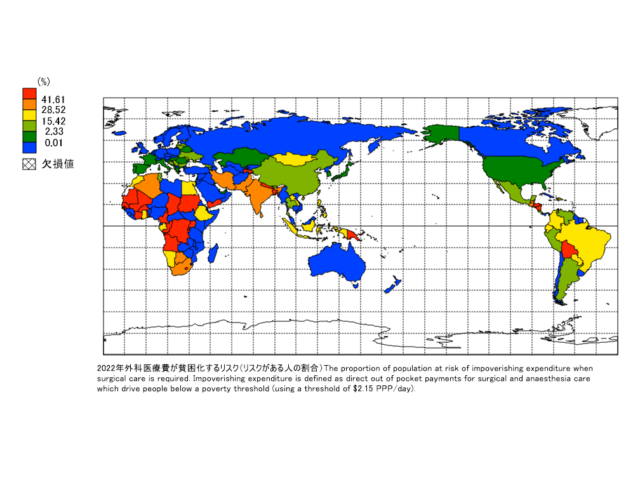
Title
The proportion of population at risk of impoverishing expenditure when surgical care is required. Impoverishing expenditure is defined as direct out of pocket payments for surgical and anaesthesia care which drive people below a poverty threshold (using a threshold of $2.15 PPP/day)
Source
The Program in Global Surgery and Social Change (PGSSC) at Harvard Medical School (https://www.pgssc.org/)
Google Earth
-
2020年65歳以上の人口
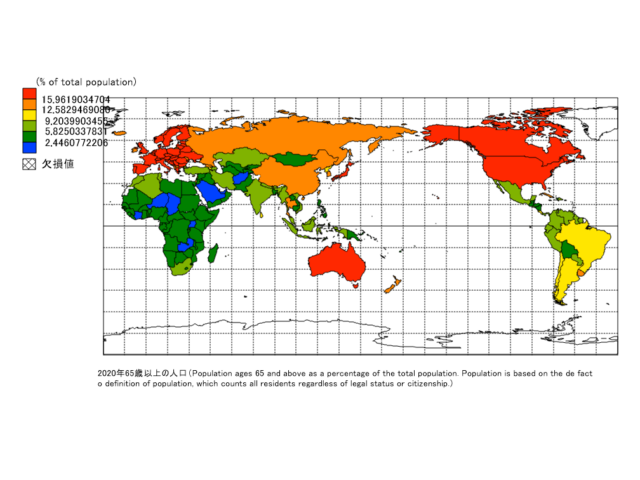
Title
Population ages 65 and above as a percentage of the total population. Population is based on the de facto definition of population, which counts all residents regardless of legal status or citizenship.
Source
United Nations Population Division. World Population Prospects: 2022 Revision.
Google Earth
-
2022年外科治療に対する破滅的支出のリスク(リスクがある人の割合)
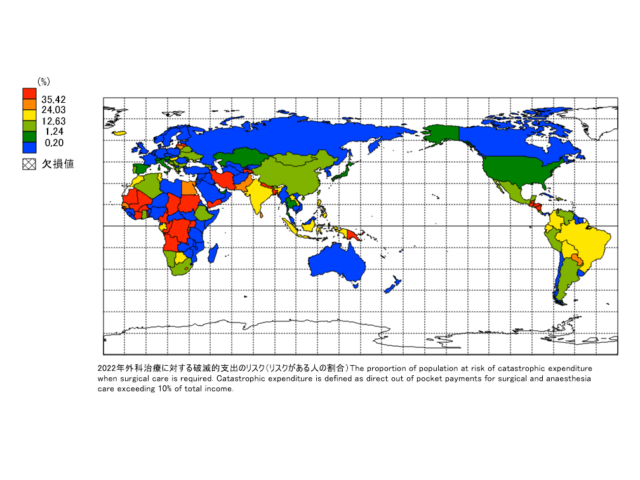
Title
The proportion of population at risk of catastrophic expenditure when surgical care is required. Catastrophic expenditure is defined as direct out of pocket payments for surgical and anaesthesia care exceeding 10% of total income.
Source
The Program in Global Surgery and Social Change (PGSSC) at Harvard Medical School (https://www.pgssc.org/)
Google Earth
-
2021年栄養不良の有病率
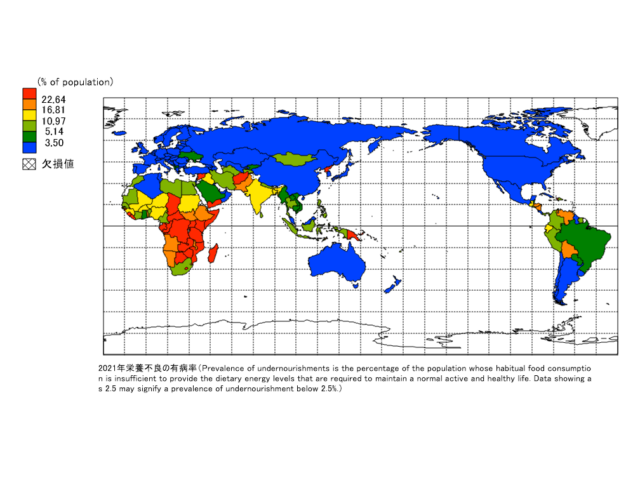
Title
Prevalence of undernourishments is the percentage of the population whose habitual food consumption is insufficient to provide the dietary energy levels that are required to maintain a normal active and healthy life. Data showing as 2.5 may signify a prevalence of undernourishment below 2.5%.
Source
Food and Agriculture Organization (http://www.fao.org/faostat/en/#home).
Google Earth
-
2019年避妊に対するニーズの不充分率
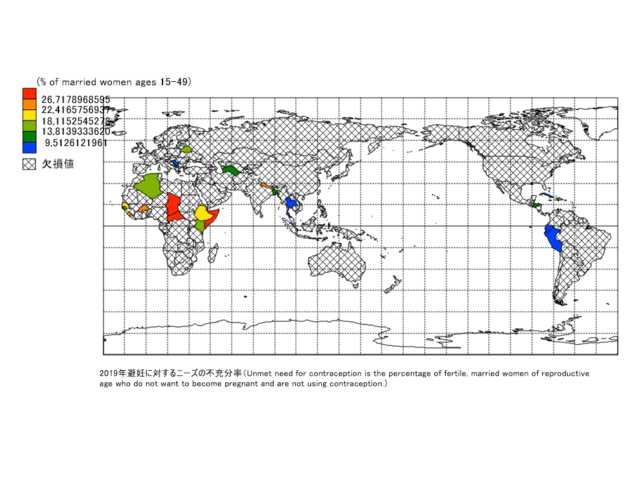
Title
Unmet need for contraception is the percentage of fertile, married women of reproductive age who do not want to become pregnant and are not using contraception.
Source
Household surveys, including Demographic and Health Surveys and Multiple Indicator Cluster Surveys. Largely compiled by United Nations Population Division.
Google Earth
-
2022年安全に管理された衛生サービス利用率
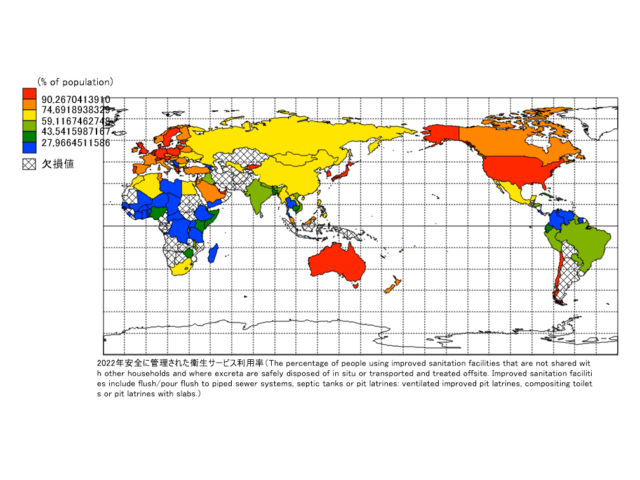
Title
The percentage of people using improved sanitation facilities that are not shared with other households and where excreta are safely disposed of in situ or transported and treated offsite. Improved sanitation facilities include flush/pour flush to piped sewer systems, septic tanks or pit latrines: ventilated improved pit latrines, compositing toilets or pit latrines with slabs.
Source
WHO/UNICEF Joint Monitoring Programme (JMP) for Water Supply, Sanitation and Hygiene (washdata.org).
Google Earth
-
2022年HIV/エイズ孤児
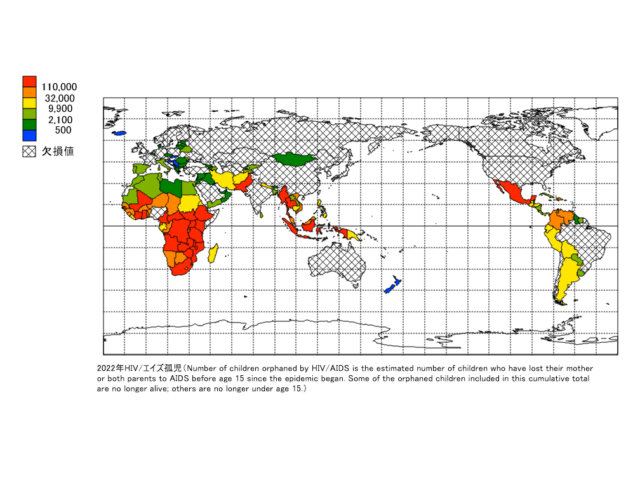
Title
Number of children orphaned by HIV/AIDS is the estimated number of children who have lost their mother or both parents to AIDS before age 15 since the epidemic began. Some of the orphaned children included in this cumulative total are no longer alive; others are no longer under age 15.
Source
UNAIDS estimates.
Google Earth
-
2020年出生時平均余命
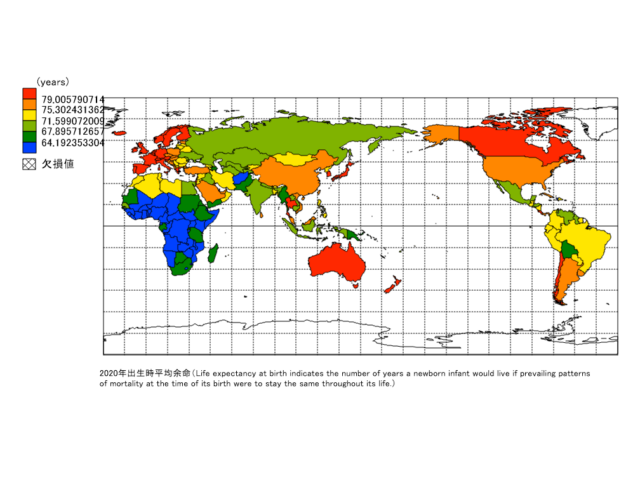
Title
Life expectancy at birth indicates the number of years a newborn infant would live if prevailing patterns of mortality at the time of its birth were to stay the same throughout its life.
Source
(1) United Nations Population Division. World Population Prospects: 2022 Revision, or derived from male and female life expectancy at birth from sources such as: (2) Census reports and other statistical publications from national statistical offices, (3) Eurostat: Demographic Statistics, (4) United Nations Statistical Division. Population and Vital Statistics Reprot (various years), (5) U.S. Census Bureau: International Database, and (6) Secretariat of the Pacific Community: Statistics and Demography Programme.
Google Earth
-
2022年HIVとともに生きる子どもたち(0~14歳)
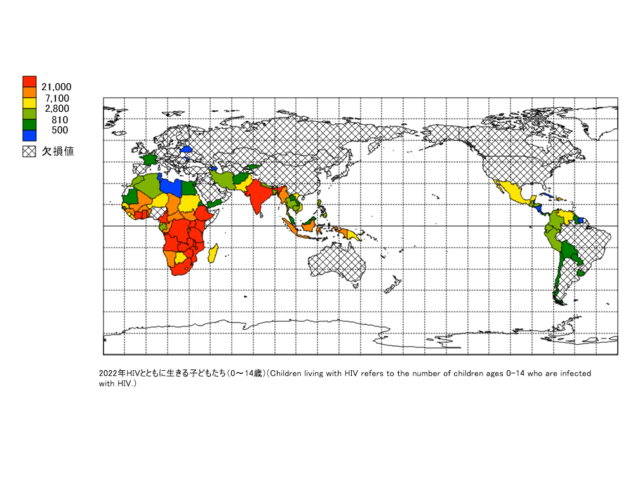
Title
(Children living with HIV refers to the number of children ages 0-14 who are infected with HIV.
Source
UNAIDS estimates.
Google Earth
-
2022年HIVに新たに感染した子ども(0~14歳)
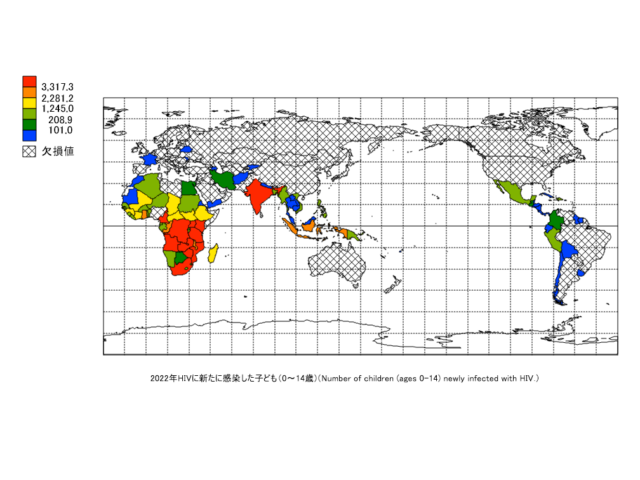
Title
(Number of children (ages 0-14) newly infected with HIV.
Source
UNAIDS estimates.
Google Earth
-
2019年非伝染性疾患別死因
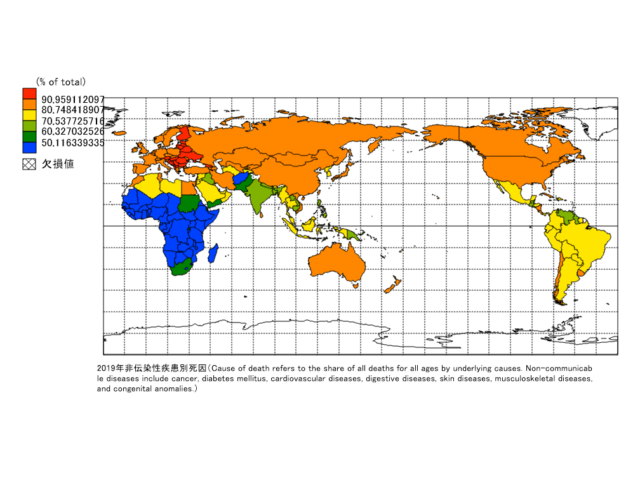
Title
Cause of death refers to the share of all deaths for all ages by underlying causes. Non-communicable diseases include cancer, diabetes mellitus, cardiovascular diseases, digestive diseases, skin diseases, musculoskeletal diseases, and congenital anomalies.
Source
Derived based on the data from Global Health Estimates 2020: Deaths by Cause, Age, Sex, by Country and by Region, 2000-2019. Geneva, World Health Organization; 2020. Link: https://www.who.int/data/gho/data/themes/mortality-and-global-health-estimates/ghe-leading-causes-of-death
Google Earth
-
2019年伝染病および妊産婦・栄養状態別の死因
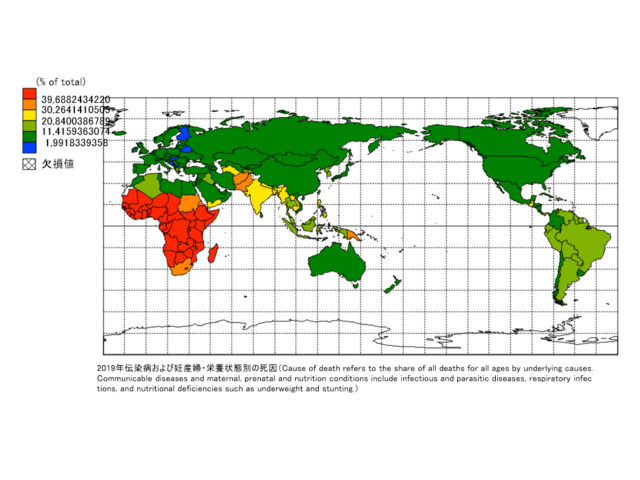
Title
Cause of death refers to the share of all deaths for all ages by underlying causes. Communicable diseases and maternal, prenatal and nutrition conditions include infectious and parasitic diseases, respiratory infections, and nutritional deficiencies such as underweight and stunting.
Source
Derived based on the data from Global Health Estimates 2020: Deaths by Cause, Age, Sex, by Country and by Region, 2000-2019. Geneva, World Health Organization; 2020. Link: https://www.who.int/data/gho/data/themes/mortality-and-global-health-estimates/ghe-leading-causes-of-death
Google Earth
-
2019年負傷別死因
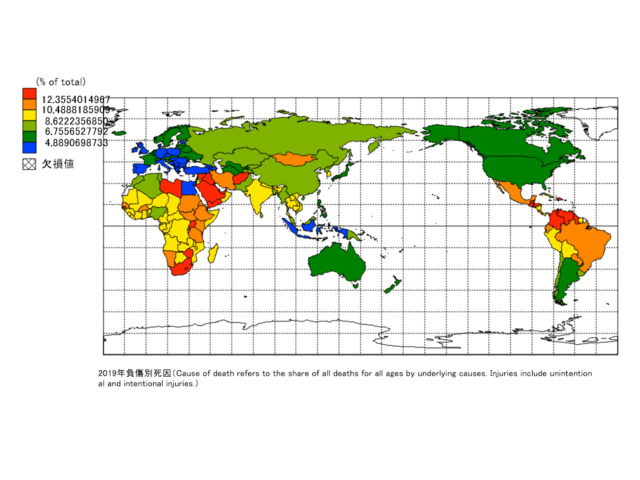
Title
Cause of death refers to the share of all deaths for all ages by underlying causes. Injuries include unintentional and intentional injuries.
Source
Derived based on the data from Global Health Estimates 2020: Deaths by Cause, Age, Sex, by Country and by Region, 2000-2019. Geneva, World Health Organization; 2020. Link: https://www.who.int/data/gho/data/themes/mortality-and-global-health-estimates/ghe-leading-causes-of-death
Google Earth
-
2019年熟練した医療スタッフによる出産率
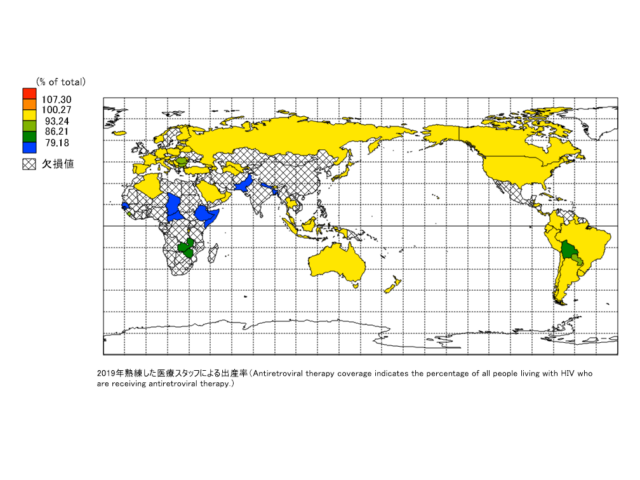
Title
Antiretroviral therapy coverage indicates the percentage of all people living with HIV who are receiving antiretroviral therapy.
Source
UNICEF, State of the World’s Children, Childinfo, and Demographic and Health Surveys.
Google Earth
-
2021年資本保健支出
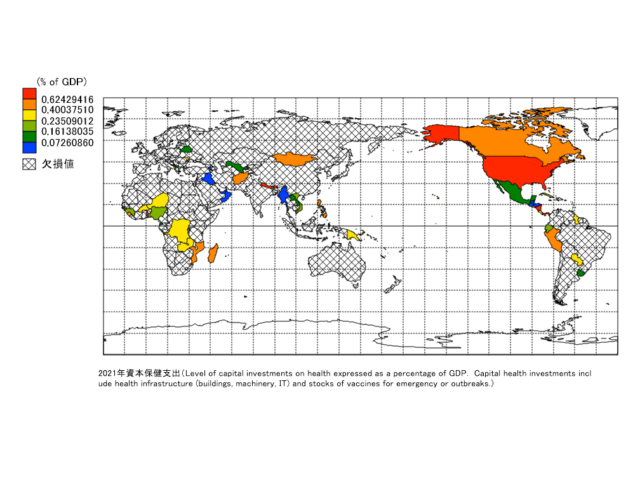
Title
Level of capital investments on health expressed as a percentage of GDP. Capital health investments include health infrastructure (buildings, machinery, IT) and stocks of vaccines for emergency or outbreaks.
Source
World Health Organization Global Health Expenditure database (http://apps.who.int/nha/database). The data was retrieved on April 15, 2024.
Google Earth
-
2022年抗レトロウイルス療法の普及率
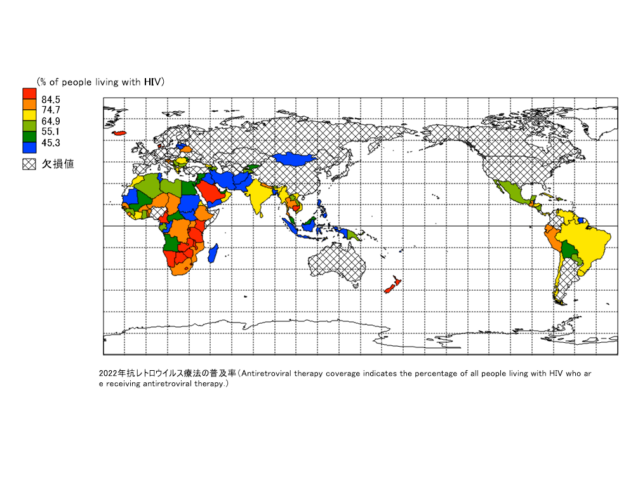
Title
Antiretroviral therapy coverage indicates the percentage of all people living with HIV who are receiving antiretroviral therapy.
Source
UNAIDS estimates.
Google Earth
-
2022年5歳未満児死亡率
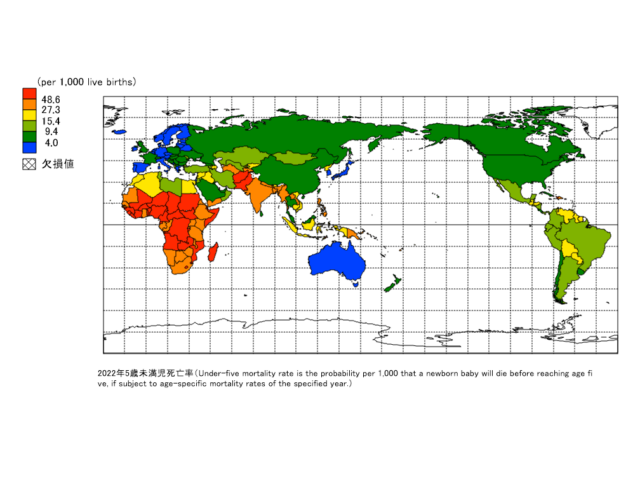
Title
Under-five mortality rate is the probability per 1,000 that a newborn baby will die before reaching age five, if subject to age-specific mortality rates of the specified year.
Source
Estimates developed by the UN Inter-agency Group for Child Mortality Estimation (UNICEF, WHO, World Bank, UN DESA Population Division) at www.childmortality.org.
Google Earth
-
2022年エイズ推定死亡者数
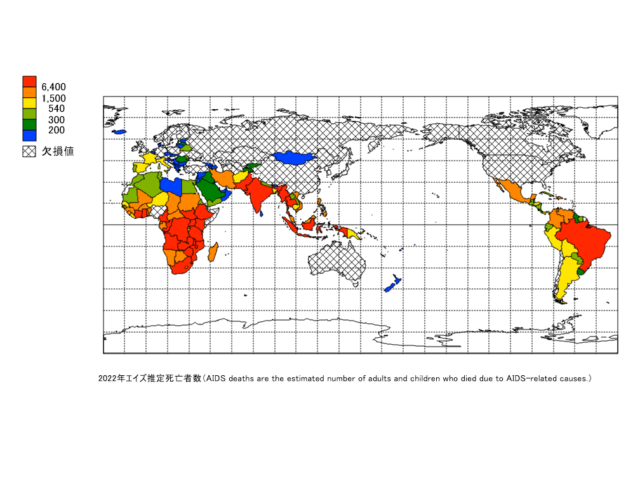
Title
AIDS deaths are the estimated number of adults and children who died due to AIDS-related causes.
Source
UNAIDS estimates.
Google Earth
-
2022年乳児死亡率
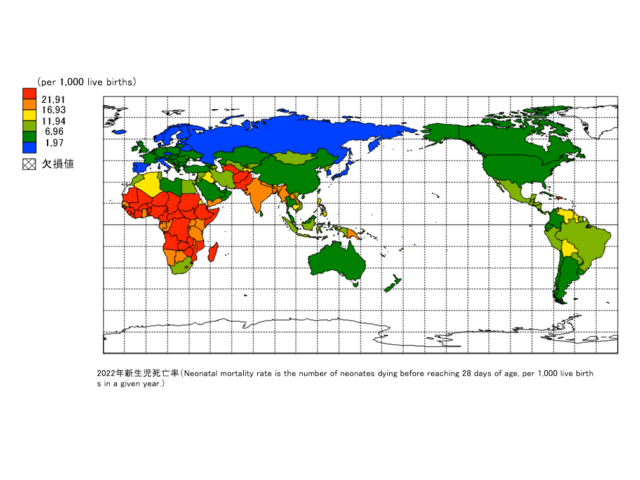
Title
Infant mortality rate is the number of infants dying before reaching one year of age, per 1,000 live births in a given year.
Source
Estimates developed by the UN Inter-agency Group for Child Mortality Estimation (UNICEF, WHO, World Bank, UN DESA Population Division) at www.childmortality.org.
Google Earth
-
2022年新生児死亡率
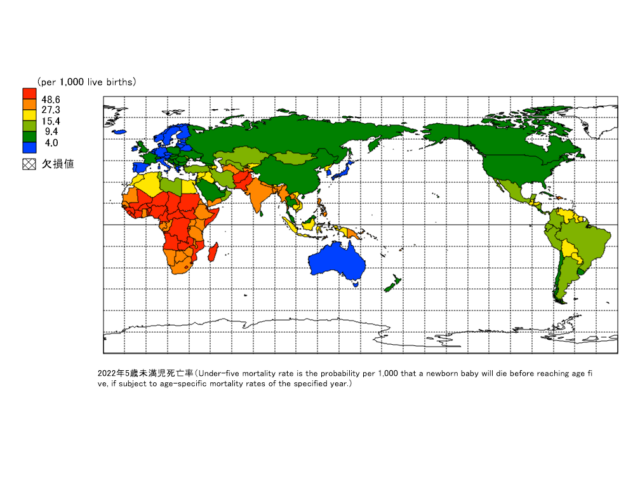
Title
Neonatal mortality rate is the number of neonates dying before reaching 28 days of age, per 1,000 live births in a given year.
Source
Estimates developed by the UN Inter-agency Group for Child Mortality Estimation (UNICEF, WHO, World Bank, UN DESA Population Division) at www.childmortality.org.
Google Earth
-
2022年死亡率、成人、男性
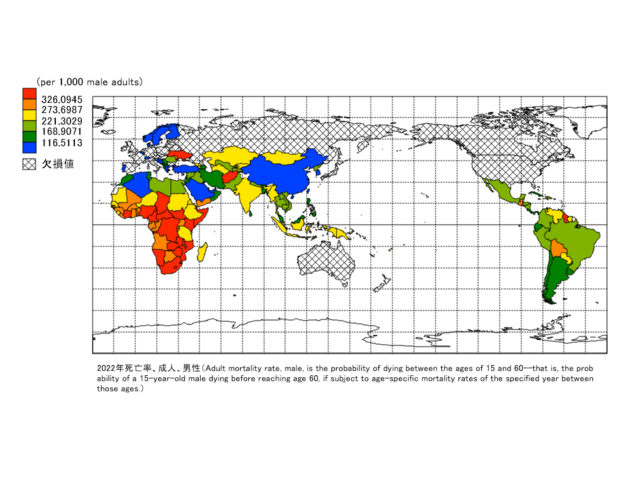
Title
Adult mortality rate, male, is the probability of dying between the ages of 15 and 60–that is, the probability of a 15-year-old male dying before reaching age 60, if subject to age-specific mortality rates of the specified year between those ages.
Source
(1) United Nations Population Division. World Population Prospects: 2022 Revision. (2) HMD. Human Mortality Database. Max Planck Institute for Demographic Research (Germany), University of California, Berkeley (USA), and French Institute for Demographic Studies (France). Available at www.mortality.org.
Google Earth
-
2019年安全でない水、安全でない衛生設備、不衛生が原因とされる死亡率
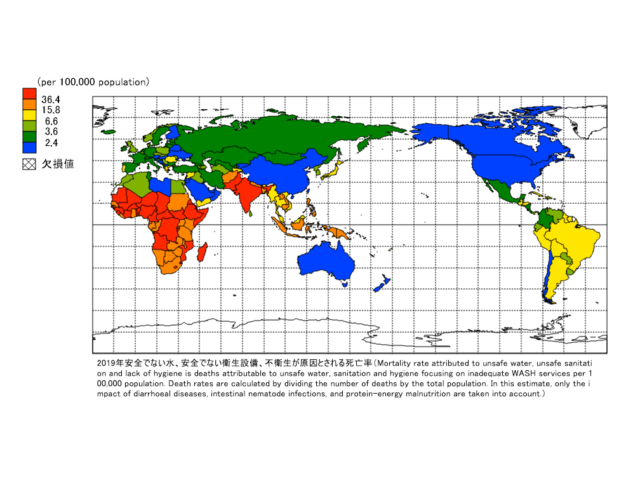
Title
Mortality rate attributed to unsafe water, unsafe sanitation and lack of hygiene is deaths attributable to unsafe water, sanitation and hygiene focusing on inadequate WASH services per 100,000 population. Death rates are calculated by dividing the number of deaths by the total population. In this estimate, only the impact of diarrhoeal diseases, intestinal nematode infections, and protein-energy malnutrition are taken into account.
Source
World Health Organization, Global Health Observatory Data Repository (http://apps.who.int/ghodata/).
Google Earth
-
2022年死亡率、成人、女性
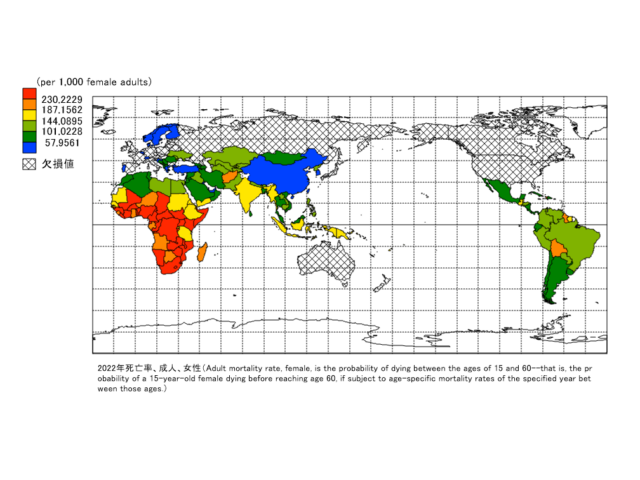
Title
Adult mortality rate, female, is the probability of dying between the ages of 15 and 60–that is, the probability of a 15-year-old female dying before reaching age 60, if subject to age-specific mortality rates of the specified year between those ages.
Source
(1) United Nations Population Division. World Population Prospects: 2022 Revision. (2) HMD. Human Mortality Database. Max Planck Institute for Demographic Research (Germany), University of California, Berkeley (USA), and French Institute for Demographic Studies (France). Available at www.mortality.org.
Google Earth
-
2019年家庭および周囲の大気汚染に起因する死亡率
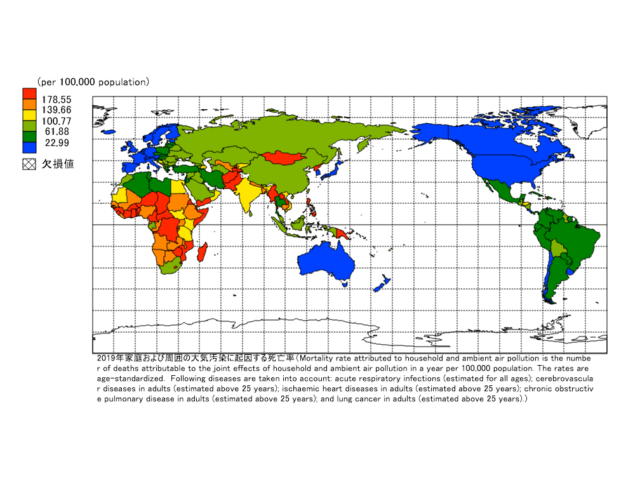
Title
Mortality rate attributed to household and ambient air pollution is the number of deaths attributable to the joint effects of household and ambient air pollution in a year per 100,000 population. The rates are age-standardized. Following diseases are taken into account: acute respiratory infections (estimated for all ages); cerebrovascular diseases in adults (estimated above 25 years); ischaemic heart diseases in adults (estimated above 25 years); chronic obstructive pulmonary disease in adults (estimated above 25 years); and lung cancer in adults (estimated above 25 years).
Source
World Health Organization, Global Health Observatory Data Repository (http://apps.who.int/ghodata/).
Google Earth
-
2019年交通事故による死亡率
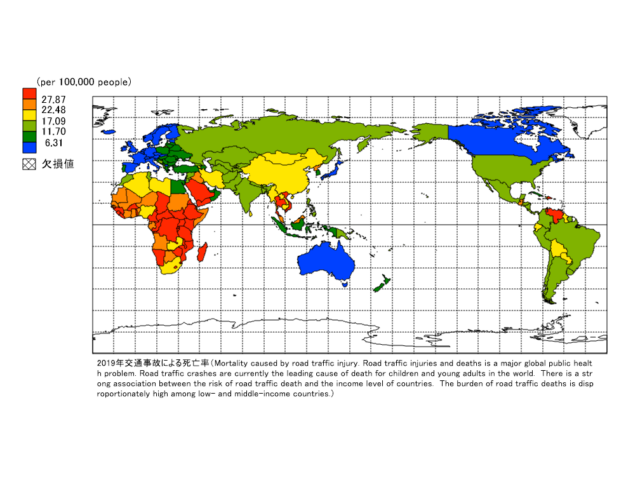
Title
Mortality caused by road traffic injury. Road traffic injuries and deaths is a major global public health problem. Road traffic crashes are currently the leading cause of death for children and young adults in the world. There is a strong association between the risk of road traffic death and the income level of countries. The burden of road traffic deaths is disproportionately high among low- and middle-income countries.
Source
World Health Organization, Global Health Observatory Data Repository (http://apps.who.int/ghodata/).
Google Earth
-
2019年30~70歳における心血管疾患、がん、糖尿病、慢性呼吸器疾患による死亡率
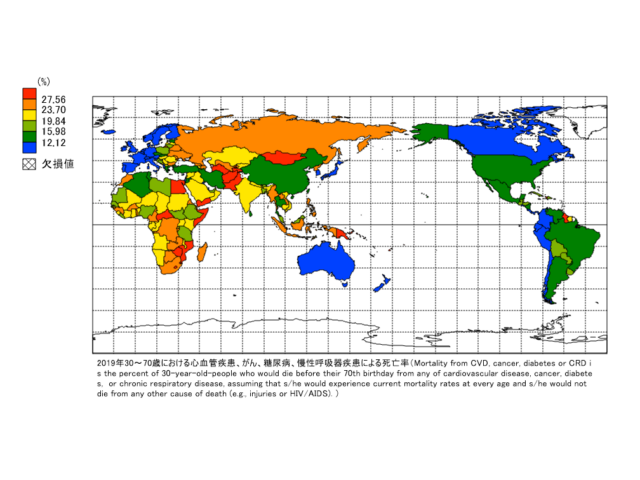
Title
Mortality from CVD, cancer, diabetes or CRD is the percent of 30-year-old-people who would die before their 70th birthday from any of cardiovascular disease, cancer, diabetes, or chronic respiratory disease, assuming that s/he would experience current mortality rates at every age and s/he would not die from any other cause of death (e.g., injuries or HIV/AIDS).
Source
World Health Organization, Global Health Observatory Data Repository (http://apps.who.int/ghodata/).
Google Earth


